Introduction
A popular demonstration for colleges and university chemistry classes is to introduce students to chemical reaction kinetics by monitoring the reaction between Crystal Violet dye and sodium hydroxide. This particular reaction can be monitored by UV-visible spectrophotometry and is even introduced to high school science classes these days.
The advantage of this reaction is that it takes place over a timescale of several minutes, which is convenient for a lab teaching session. And students are introduced to the principles of chemical reaction rates, the order of a chemical reaction, rate laws and the rate constant. Explanations of all these terms can be easily found online.
So in this blog post I am going to look at this reaction in some detail, which is also one that we, as amateur experimenters, can easily perform in the home lab.
First of all we have to consider the reactants.
Crystal Violet
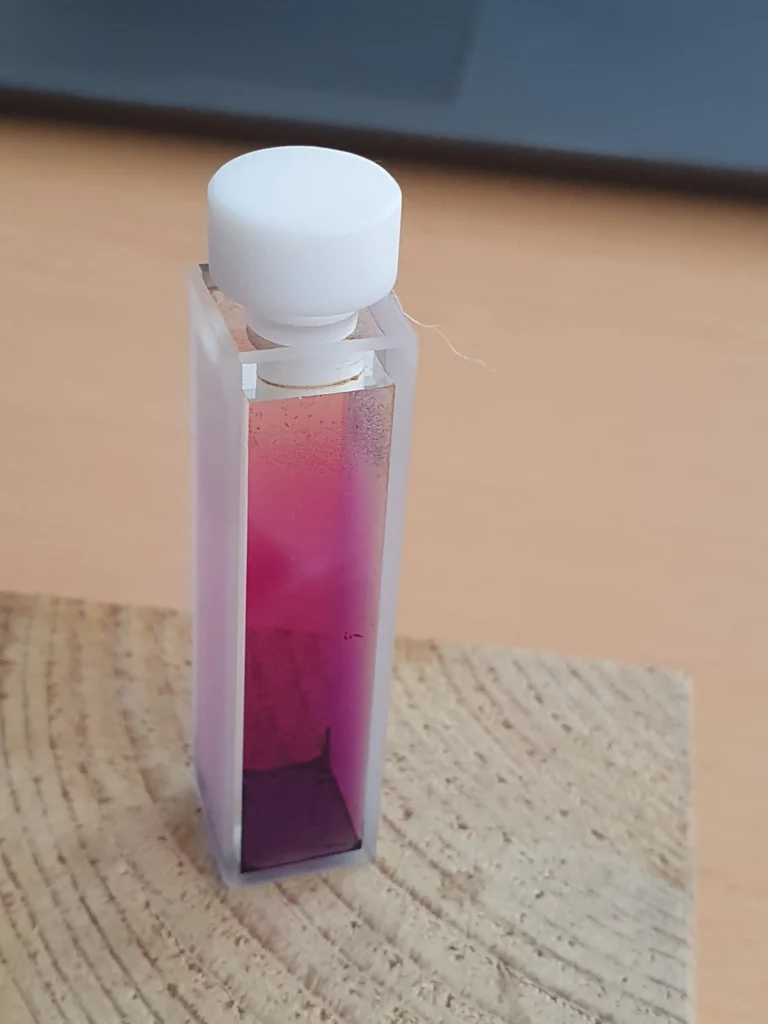
Pure Crystal Violet (CV) is also known as Gentian Violet because of its colour, although the dye itself is not obtained from the gentian plant family. In solid crystalline form it is dark green. But when a small amount is dissolved in water it produces a deep and vibrant purple solution.
The dye belongs to a class of intensely coloured organic compounds called the triphenylmethane dyes. These dyes were mentioned, albeit very briefly, in an earlier article some time ago, because they are used to formulate blue coloured fluorescent highlighter pens. The chemical structure and colour of the dye both depend on pH. This makes the dye a very useful acid−base indicator in addition to its dyeing ability as a common stain in cell biology as well as other applications.
The chemical structure of CV is often expressed in what are called resonance forms or resonance structures. In chemistry, the concept of resonance (also called mesomerism) means that the molecule is best described not as a single fixed structure, but as a mix of two or more contributing chemical structures that more accurately represent the actual form of the molecule in terms of its chemical properties and behaviour. It is these contributing structures that are called resonance forms, or canonical structures, and a combination of all these forms is called a resonance hybrid.
Much more information on the concept of resonance can be found online at the usual sources – just search for ‘resonance in chemistry’.
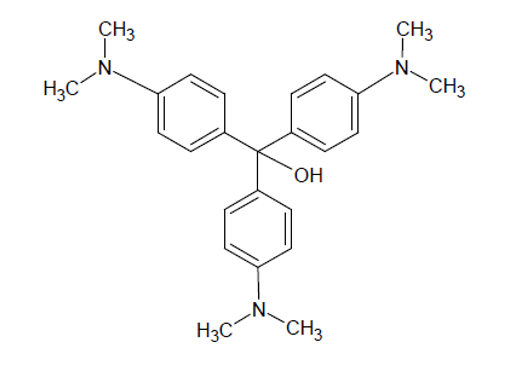
For crystal violet, there are several resonance forms, two of which are shown here:
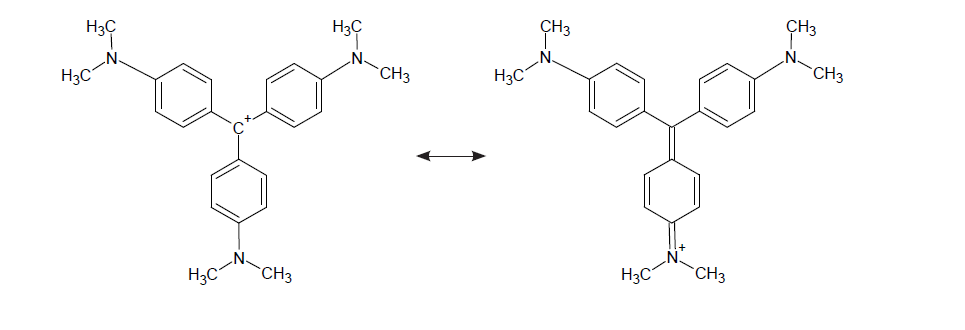
It is the monovalent cation form on the left in the above image that is the predominant resonance structure in the pure dye as a solid and also in aqueous solution across a broad range of pH. I shall call this CV+, where the positive charge resides on the central carbon atom. The form on the right is one of three equivalent structures that show the positive charge on one of the nitrogen atoms… there are two other equivalent forms with the positive charge on the other nitrogens.
These three forms have the result of stabilising the carbo-cation (C+) in the left hand structure above, and have delocalised the charge through resonance, spreading this charge across the 3 benzene rings to produce a highly conjugated system. As a result of this high degree of conjugation (alternating single and double bonds), the dye is intensely coloured. In this particular case the dye is a brilliant purple colour.
Reaction with Sodium Hydroxide
In strongly alkaline (basic) solutions, the purple coloured CV+ cation slowly reacts with hydroxyl ions (OH–) from sodium hydroxide to form the neutral and colourless reaction product, CVOH, shown here:
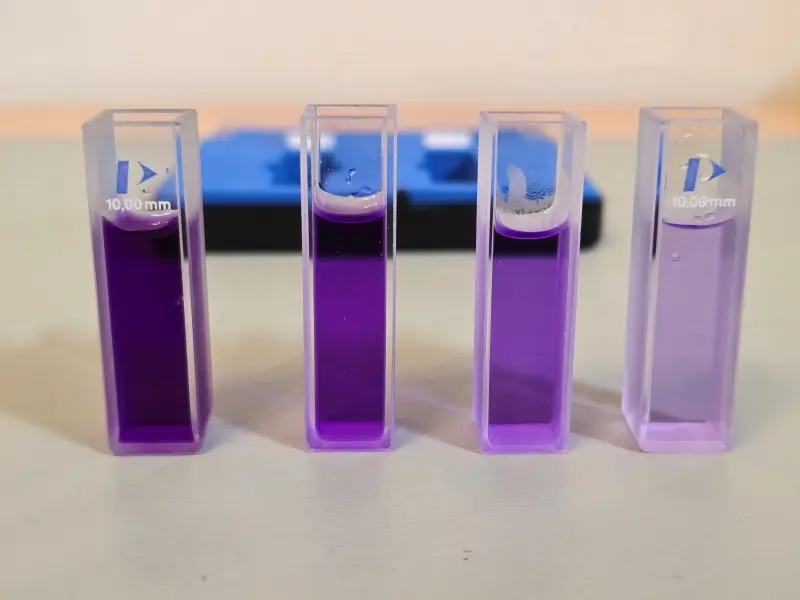
The hydroxyl group attaches to the central carbon and breaks the high degree of conjugation in the molecule, the source of the colour. As a result, the bright purple colour of this dye gradually fades during the reaction and the chemical equation can be written as:
CV+ + OH– → CVOH
Purple Colourless
The speed of this reaction depends on the quantities of the two starting materials (the reactants). Fundamentally, chemical reactions are due to collisions between each reacting species, and the frequency with which molecules collide depends on their concentration. The more numerous the molecules are, the more likely they are to collide and react. High concentrations of reactants will lead to a higher rate of reaction.
Exactly how much the reaction rate changes as the reactant concentration changes depends on the rate law for the reaction. For the case of our reaction between CV and OH– the rate law is expressed in general terms as
Rate = k [CV+]m [OH–]n (1)
Where the two exponents m and n in the equation are defined as the order of the reaction for each reactant, CV+ and OH–, respectively, and k is the rate constant for the reaction at a certain temperature. More precisely, m and n are referred to as the partial orders of reaction for CV+ and OH–, and the sum of m and n is the overall order of reaction. The actual values of m and n have to be determined by experiment. The square brackets [ ] represent molar concentration or moles per litre.
In this particular experiment, we use a concentration of sodium hydroxide that is in very large excess compared to the concentration of crystal violet. Under these conditions, the concentration of OH– ions during the course of the reaction is virtually invariant. It can be considered to be unchanged during the reaction and therefore [OH–] remains constant in the rate equation. This is a common mathematical technique and is justified provided that the reasoning is valid. As such, the above rate equation (1) reduces to
Rate = kꞌ [CV+]m (2)
where kꞌ = k [OH–]n.
This new rate constant kꞌ is referred to as the pseudo rate constant for the reaction, incorporating both the original rate constant k and the OH– concentration term. The new expression is referred to as a pseudo-rate law since it is a simplification of the real rate law in expression (1).
In differential form, the (pseudo) first order rate equation is given by
–d/dt [CV+] = kꞌ [CV+]
and in its integrated natural log form, which is the most suitable form for analysing the data, the rate equation becomes
ln [CV+] = –kꞌ t + ln [CV+]0 (3)
where [CV+]0 is the dye concentration at time t = 0.
This experiment also assumes that the Beer-Lambert law is obeyed, which provides the basis for using spectrophotometric measurements in quantitative analysis. The law was described in some detail in this post, using potassium permanganate as an example. It is particularly relevant for our measurements here in this kinetics experiment, because it makes it possible to monitor and record the rate of disappearance of the dye by measuring its change in absorbance (A) as a function of time.
Experimental Procedure
Linearity of the Beer-Lambert law for the CV concentrations employed in this experiment was first checked and the results are shown here:
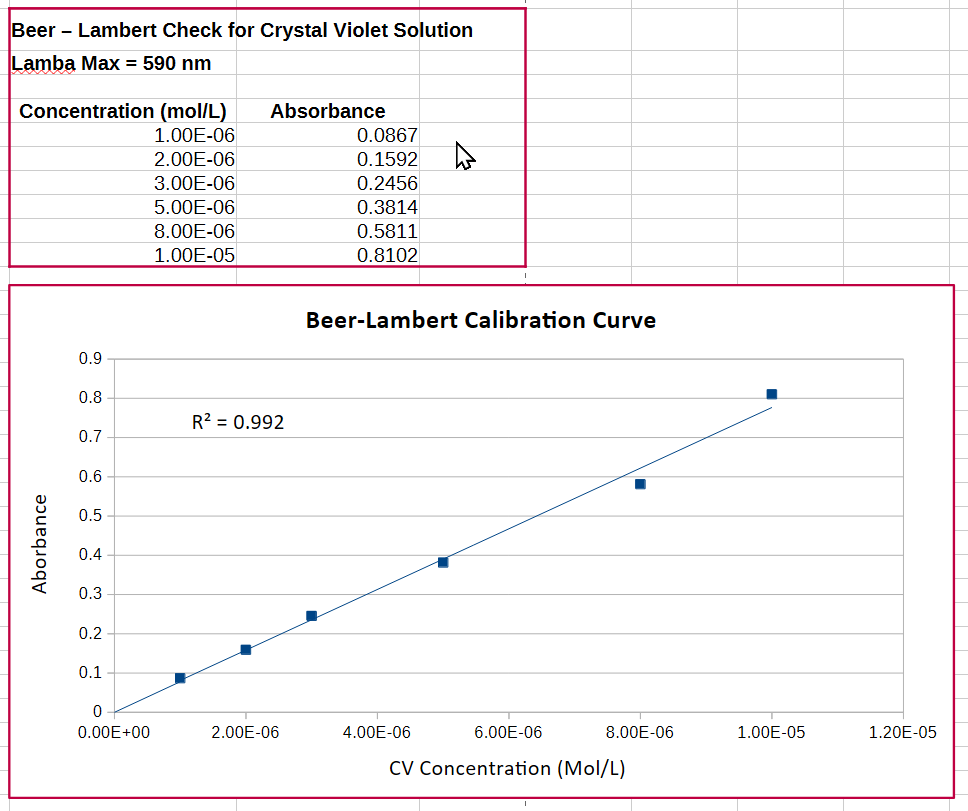
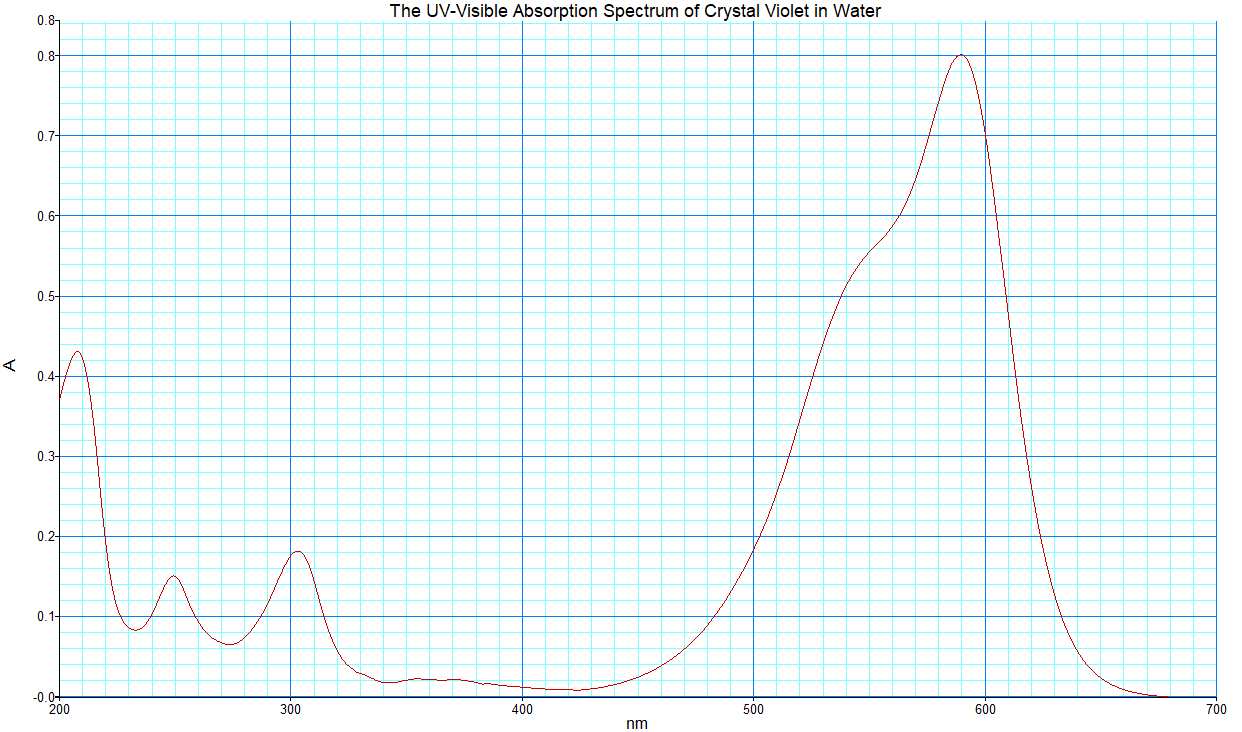
A typical concentration to use in this demonstration is from 10-6 M to 10-5 M. This ensures that the absorption falls within the linear range of the Beer-Lambert relationship. I am using a 10-5 M solution in DI water for this demo. The absorption spectrum of crystal violet across the UV and visible is shown below. The obvious strong absorption peak at 590 nm is the one we use to monitor the progress of the reaction.
Preparing a 100 mL solution of 10-5 M crystal violet would require only 0.409 mg of solid, which is totally impractical to weigh. So we prepare a stock solution of 10-3 M, and the dilute this by a factor of 100.
In order for the pseudo-rate law in equation (2) to apply, the [OH–] concentration needs to be at least 100x and ideally 1000x or more greater than [CV]. I have chosen a sodium hydroxide solution of 0.05 M for the demonstration.
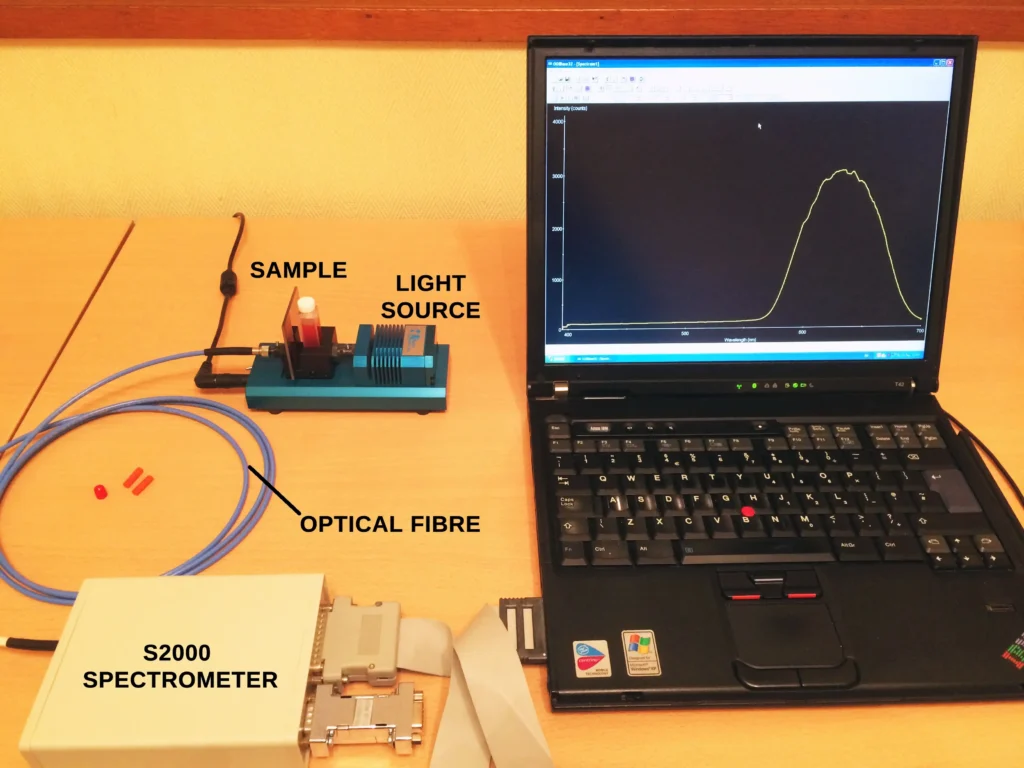
An experimental run consists of measuring the absorbance at the CV peak maximum of 590 nm as a function time in seconds or minutes. The spectrometer employed in this demonstration is a professional instrument, frequently used in analytical labs. In this case the model is a PerkinElmer Lambda 25. However, any small handheld or miniature spectrometer together with a suitable visible light source will do the job too. Such a the setup is shown here from one of my early demonstrations of absorption spectroscopy using an old Ocean Optics S2000 spectrometer, and an even older IBM Thinkpad laptop.

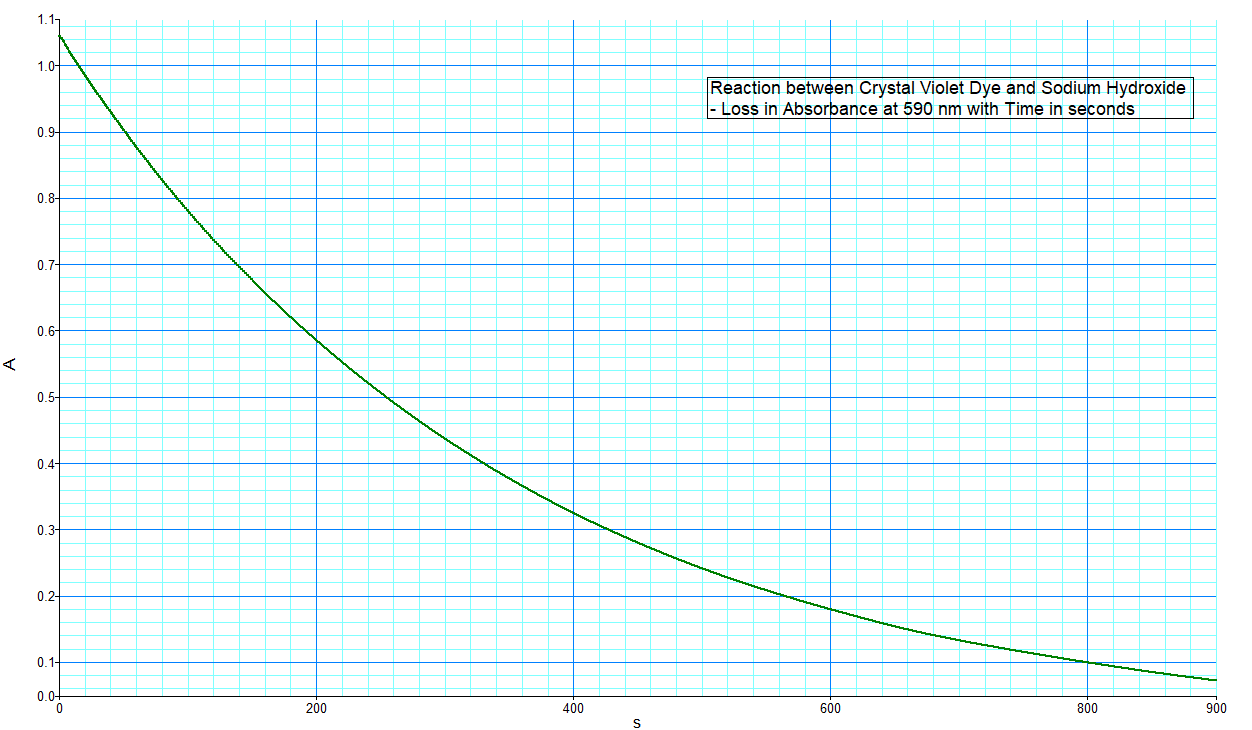
The spectrometer monitors the absorbance of the sample at 590 nm during the reaction, records absorbance values every 2 seconds, and the following decay curve is obtained
In terms of absorbance units, equation (3) above can be expressed as
ln A = –k’t + ln A0
and a plot of ln A versus t is linear with a slope equal to the rate constant –k’. Note that k’ is negative because the CV concentration is decreasing. A0 is the absorbance of crystal violet at t=0, which in practical terms is the very first absorbance reading taken when the reagents are first mixed. So as soon as the reagents are mixed, the clock starts ticking and the absorption measurement needs to be made as soon as possible. The result was provided above and the natural log plot is shown below:
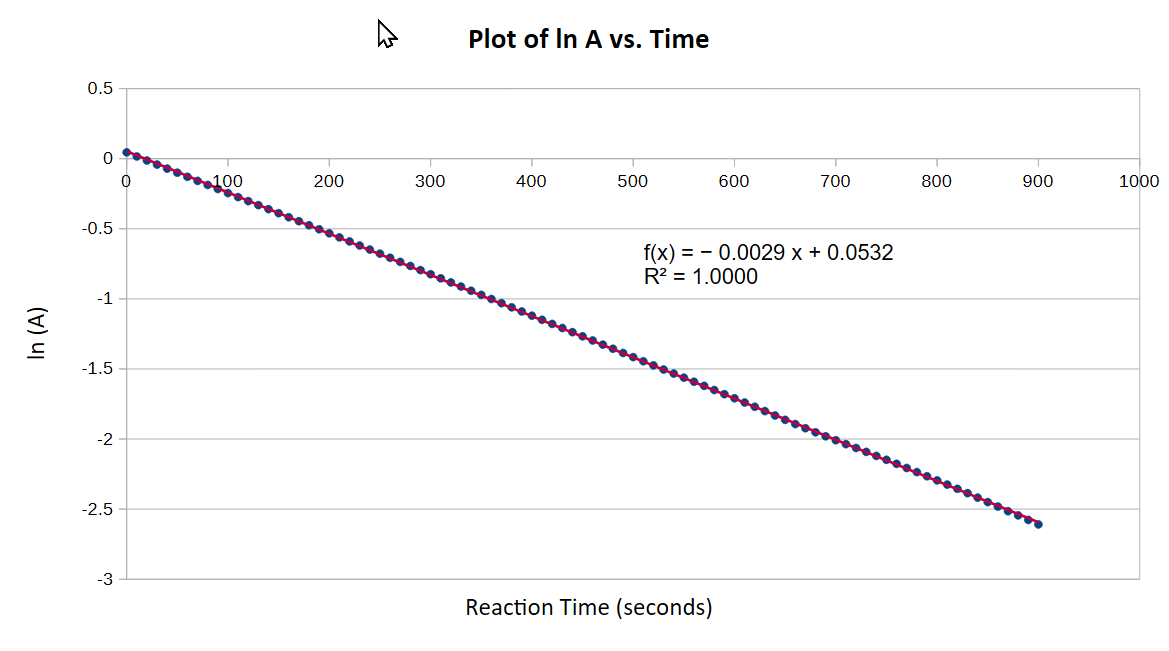
This produces a first order rate constant for the reaction of 0.0029 sec-1 or 0.174 min-1, which compares very favourably with literature values.
Final Words...
So with a simple home laboratory setup it is possible to determine some fundamental measurements of the rates of chemical reactions using spectroscopic techniques. But remember that the actual rates of reaction will vary depending on the initial concentration of the main “actor” in this particular case, sodium hydoxide.
In a future post, I will demonstrate how to perform essentially the same thing without any spectrometer at all, just by simply using your Smartphone… Wow!
From Steve’s Open Lab