
Introduction
In an earlier post, I used a sample of caesium chloride (CsCl) and a small Tesla coil to generate F centres. F centres are defects in the crystal lattice where, for caesium chloride, chlorine ions are ejected from the lattice and replaced by electrons. The electrons are able to absorb light in the visible spectrum, meaning that the crystals become coloured. More details of this effect are described in a previous video demonstration.
I went on to record a spectrum of the blue-white luminescent glow that immediately appeared when the Tesla coil’s electric field was applied. The spectrum of the blue glow is reproduced here for convenience:

I admitted at the time the post was published that I was having difficulty assigning these emission lines to the likely chemical species present in this glow discharge. So I decided to do some more research and digging, and below are the results of this search:
Emission Line Identification
From their relatively narrow profiles, the peaks may well be atomic emission lines, mostly from caesium but also chlorine. They are not due to any luminescence from the F-centres themselves. F-centre luminescent emission is typically very broad and smooth, extending over tens of nanometres, and not sharply peaked as in the above spectrum.
A provisional identification, which is based on NIST atomic data and plasma emission literature, is provided in the following table with appropriate comments on uncertainty and any line shifts:
| λ (nm) | Possible Assignment | Comments |
|---|---|---|
|
390 |
Weak Cl(I) line at 390.3 nm |
Could also be N2. Common in discharges and possible if tube was not fully evacuated |
|
411.4 |
Cl (II) |
Singly excited Cl atoms Cl (II) centred at 413.25 nm |
|
449.2 |
Cs (II) |
Singly excited Cs atoms Cs (II) officially at 450.16 and 452.67 nm. So within experimental uncertainty. |
|
481.6 |
Cs (I) |
Several neutral Cs lines in this region. But could also be Cl (II) which has a line at 481.01 nm |
|
518.5 |
Cs (II) |
Fairly strong line at 520.9 nm. Spectrometer calibration may be poor in this region |
|
560.2 |
Cs (II) |
Another strong Cs line at 556.3 nm. Wavelength calibration may be poor here. |
|
606.2 |
Cs (II) & Cs (I) |
Several Cs (I) and Cs (II) lines in this region from 593 to 612 nm. Likely to be Cs (II) ; strong in discharge tubes |
|
651.0 |
Cs (II) |
Strong line at 653.6 nm |
|
674.0 |
Cs (II) |
Strong line at 672.4 nm |
To summarize, the dominant atomic emission lines in the discharge originate principally from singly excited caesium Cs(II), some neutral caesium Cs(I) and a possible small contribution from chlorine Cl(I).
None of this emission comes from F-centres. Any F-centre luminescence would appear as a broad, featureless band across several tens of nm. F-centres are clearly formed in the crystal lattice from the visible colour change, but detecting any luminescence from the F-centres themselves is not possible under these excitation conditions.
The most common research method for reproducibly generating F-centres in metal halide lattices is by exciting a sample of the salt with 10-100 keV X-rays. Photons in this energy range will eject halide ions from lattice sites in a controllable way and produce F-centres. These could then be examined by UV irradiation to look for any direct photoluminescence. Needless to say, specialized X-ray equipment of this nature is not available to me in my modest home lab!
Let’s now take a look at other examples of metal salts excited in a strong electric field.
Potassium Iodide
In the video below is a sample of potassium iodide, again dried and sealed under vacuum. A search was conducted for F-centre using both a tesla coil and a small high-voltage power supply, but in this case no F-centres appeared and no colour change.
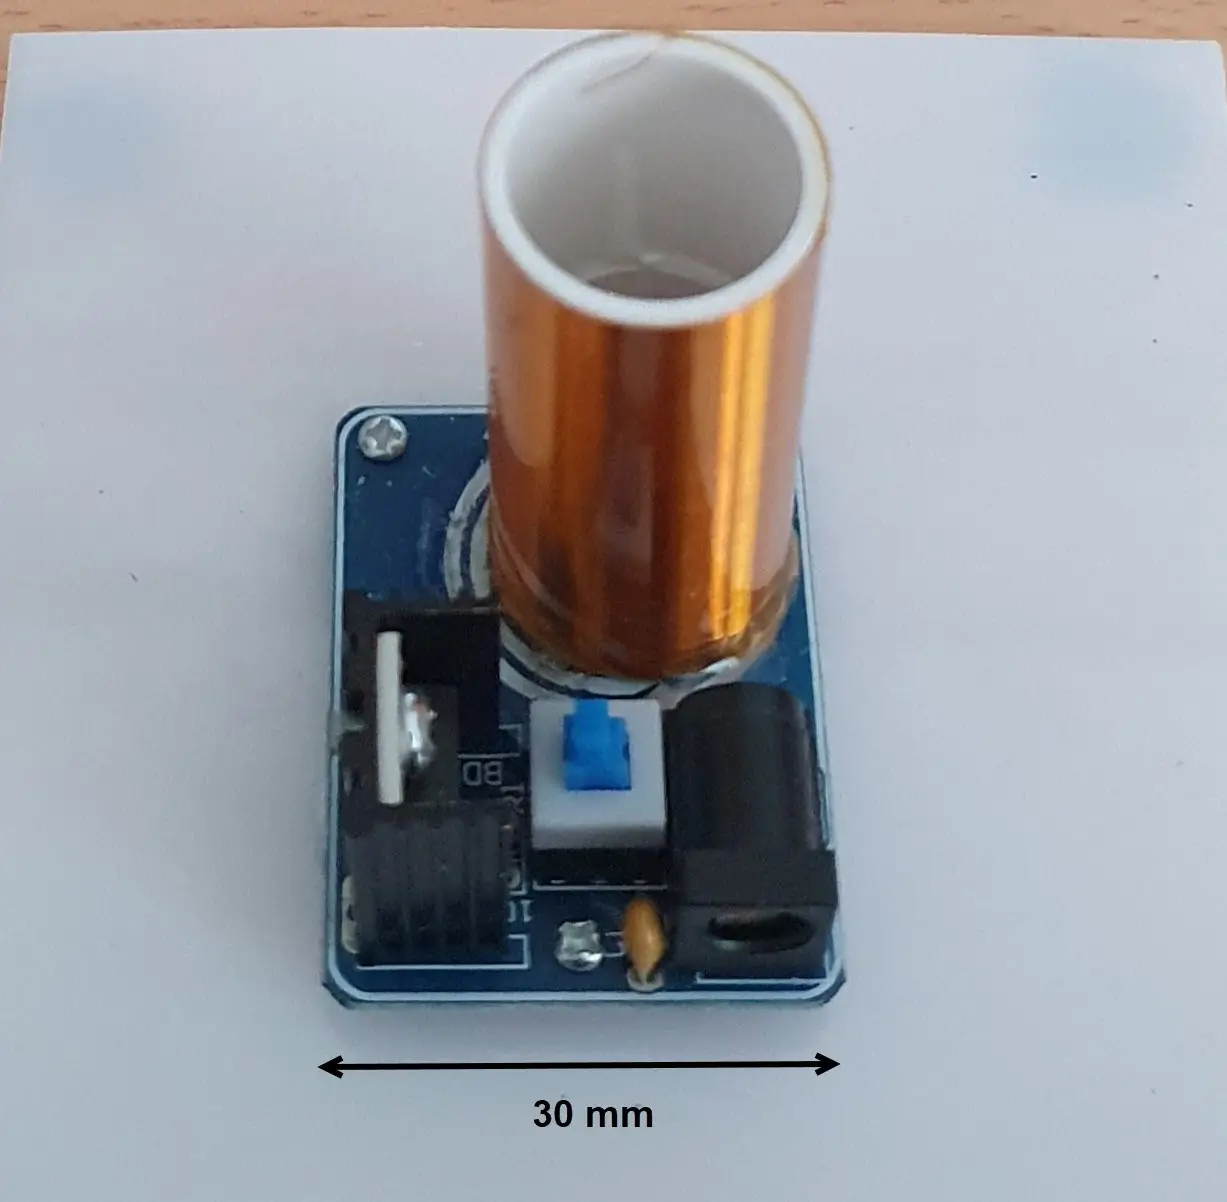
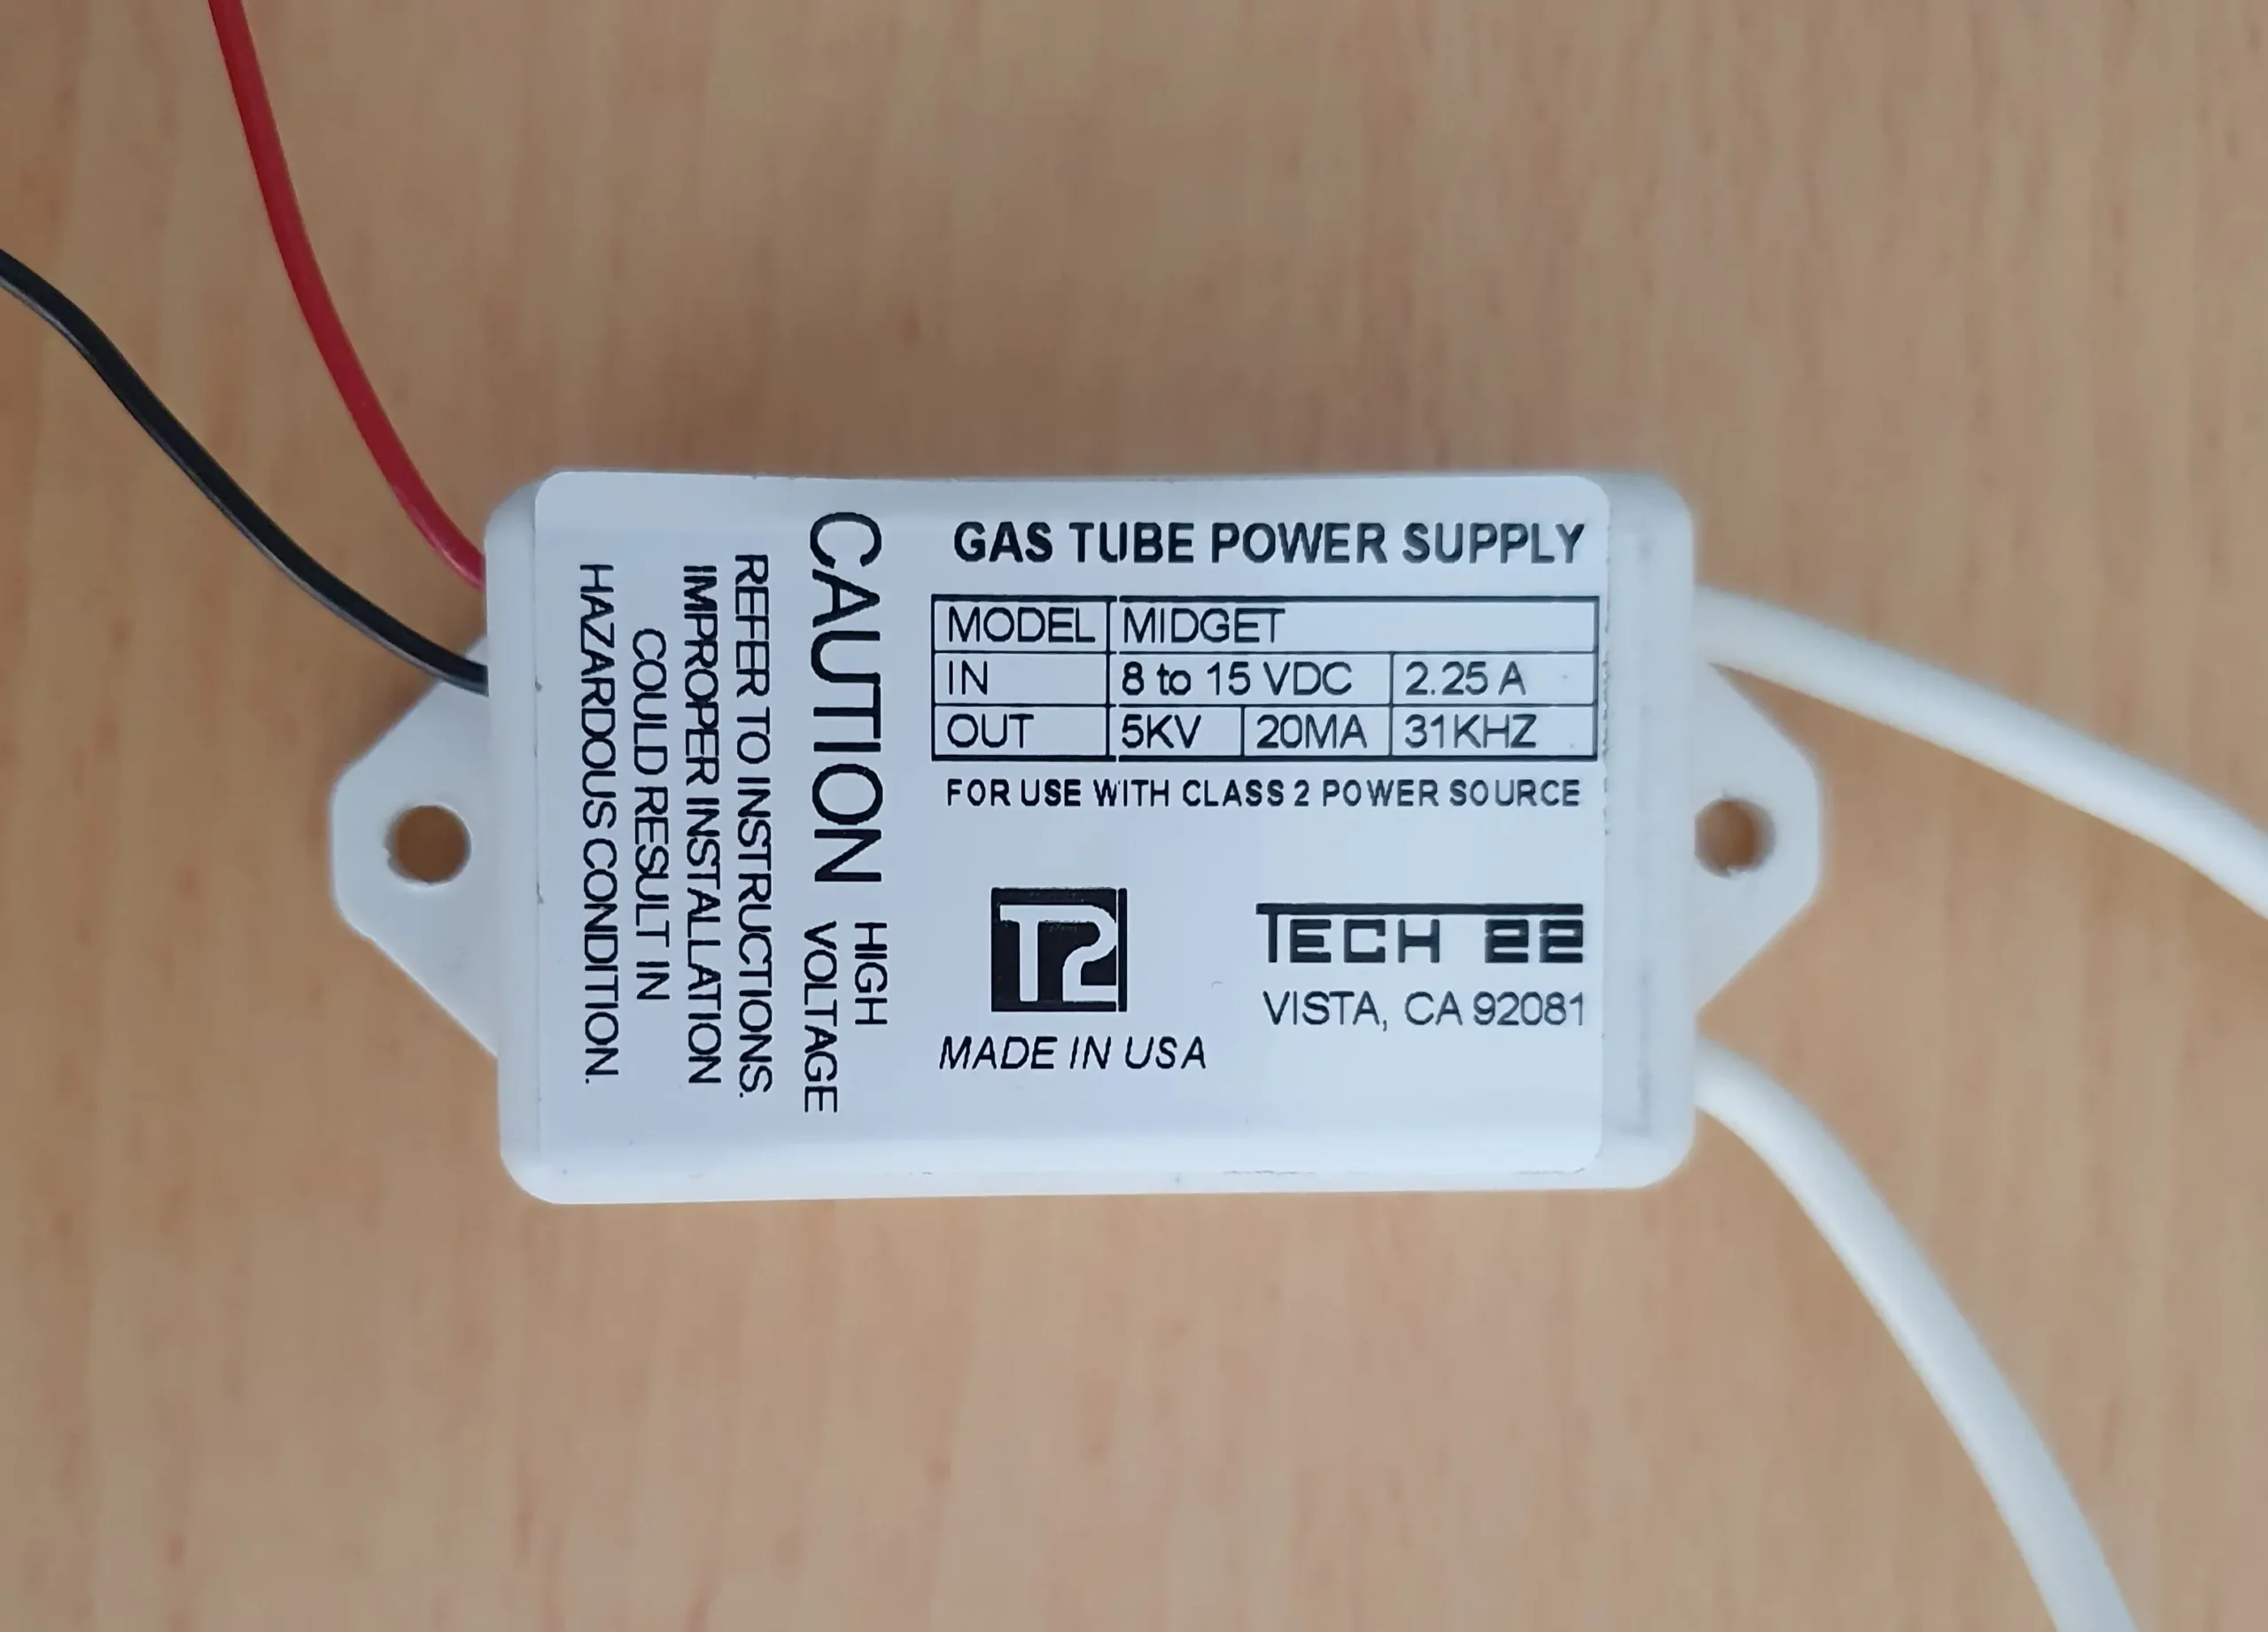
However, the high voltage did immediately generate light emission above the crystals as shown in this very short video:
As before, I recorded the visible spectrum of the glow discharge which is reproduced here:

The strong emission line at 657.4 nm is suspiciously close to the hydrogen H-alpha line at 656.3 nm. This line can, and will, appear if trace amounts of water (hence hydrogen) are present in the sample. So the sample may not have been completely dry when it was sealed in the tube.
The remaining lines are due to neutral iodine atoms I(I) or singly ionized iodine I(II).
Unlike the example of caesium chloride above, where we saw a clear colour change indicative of F-centres, there is no observed colour change with this sample and F-centres are absent under these excitation conditions. Other forms of excitation (X- and gamma-ray irradiation) are presumably needed for this sample.
Tin (IV) Iodide
I wasn’t really looking at F-centres with this sample; I just wanted to see if there was any iodine-based glow discharge similar to the case with potassium iodide.
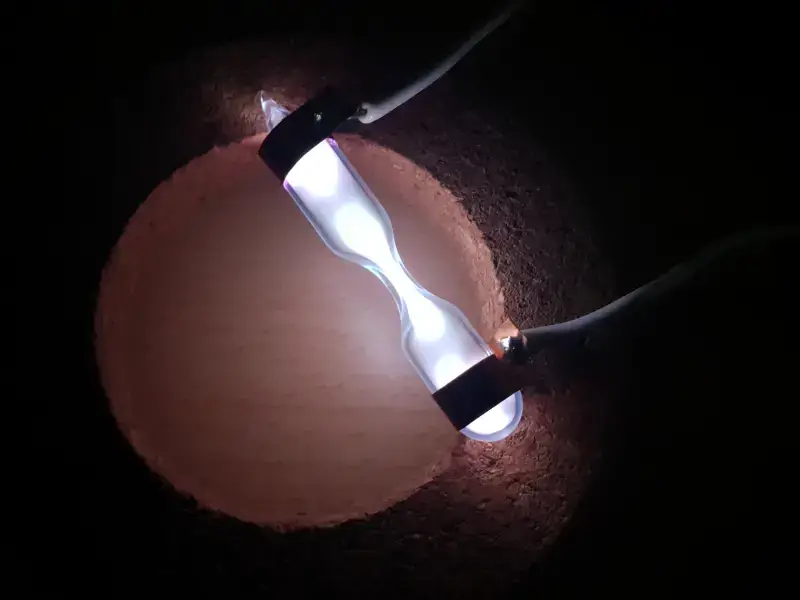
Tin (IV) iodide, also known as stannic iodide, is a red-orange crystalline solid as seen from the small sample in the tube here.

The supplier stated that the sample was pure tin iodide containing no “starter” gases, which are sometimes added to initiate gas discharge tubes of this type. So the tube was immersed in boiling water for a few minutes to increase the vapour pressure in the tube and then the same high voltage power supply as used above was applied. Here is a video (without audio this time) of the demonstration:
The purple/blue glow discharge is very similar to that seen with the potassium iodide example earlier and the spectrum of the discharge is almost the same:

There is still the H-alpha line strongly present, again indicating that the sample was not completely dry. All remaining emission lines originate from atomic iodine in different ionization states as before. The grouping from 580 – 640 nm is characteristic of molecular iodine I2 vibronic structure, similar to the absorption spectrum of I2 and its laser induced fluorescence spectrum reported in other posts elsewhere on this site. And the multiplet structure around 480 nm is where iodine has several transitions.
The strongest emission lines for tin (Sn) are in the UV and near UV/blue. Emission from Sn(I) and Sn(II) in the visible are relatively weak. If they are present in the above spectrum, they are likely hidden in the noise or masked by I atomic emission lines.
Superposing the discharge spectra from both potassium and tin samples shows virtually identical line profiles, confirming the emission lines to be largely due to I(I) and I(II).

Final Words...
A future article may look at other techniques to generate F-centres in metal halide and other inorganic salts.
15 thoughts on “Colour-Changing Crystals – An Update on F Centres”
Dear Steve,
I think that the emission spectrum that you are seeing is simply that of diatomic chlorine gas (Cl2). The chlorine spectrum on the website atomic-spectra.net looks very much like your spectrum. I have re-created your experiment in my own home lab, and my spectrum looks very much like your spectrum, and that on the website mentioned. I think we are seeing molecular chlorine emission bands, not atomic lines, and the molecular bands are always much more difficult to find solid data about. Presumably, the Tesla field ejects electrons from the chloride anions (Cl-). Eventually, these electrons slow down enough to take up residence in the solid matrix of the cesium chloride salt itself (CsCl), staining that material blue. This is kind of like solutions of solvated electrons in liquid ammonia and liquid organic amine solvents, which are also spectacularly blue. The process is apparently reversible, as the blue color of the salt eventually disappears. But some chlorine gas always seems to be present, suggesting that the blue color is also always present at some level, just not enough to register to human eyes after a long period of sitting idle. Fortunately for us, the amount of chlorine produced creates just the right internal pressure for a strong and bright electrical discharge effect. I am very grateful to you for bringing this phenomenon to my attention, since I have wasted I don’t know how much money on halogen spectrum tubes. They always stop working after a short time, probably because of a chemical reaction between the metal electrodes and the halogen gas. With electrodeless tubes like this from smartelements.com, and a small and inexpensive Tesla coil (10 USD), I can now observe halogen emission spectra for as long as I want, and the tubes don’t self-destruct! As for the cesium content of the salt (Cs+), I initially thought that the cesium cations were getting reduced to the metal. But I now think these ions remain unchanged throughout, and the color change is purely due to the electrons from the chloride anions depositing in natural cavities in the salt. Your website is truly an inspiration to all home experimenters, and I wish you the best of luck on your future endeavors. I particularly enjoyed your iodine fluorescence experiment, and I was able to reproduce the odd yellow-orange glow of molecular iodine (I2) when excited by a green laser pointer (532 nm). However, I could only get a really bright glow when the iodine crystals were allowed to vaporize in a vacuum. Using a night vision scope, and a visible light-blocking NIR filter, there is also an infrared glow from iodine when excited by a 650 nm red diode laser pointer. A red He-Ne laser is also supposed to work (632.8 nm), but I could never see any glow with this type of laser. All of the diode and DPSS lasers I have tried on iodine vapor in a low-pressure environment show a strange, random, pulsing glow, apparently because the wavelength shifts around as the laser heats up, and only certain of these wavelengths are effective at causing iodine fluorescence. Happy experimenting! Respectfully, Gerry Francisco.
Hello Gerry,
Many thanks for your kind comments on the website. For the most part, I try to create articles and demonstrations that are accessible to home experimenters with a minimum of investment, although some posts do require more sophisticated equipment.
You are probably right about the nature of the emission bands observed with the caesium chloride experiment; they are very likely to be due to molecular chlorine and not chlorine atoms. The bands appear far too broad to be due to atomic emission.
My experience with regular spectrum tubes with metal electrodes is very similar to yours – over time they degrade and can be unreliable, especially the cheaper versions which can be contaminated with trace amounts of moisture during manufacture and as a result a strong H-beta line from atomic hydrogen can dominate the spectrum. The ones that give me the best results are spectral calibration lamps from Newport/Oriel. Thorlabs also market them. I calibrate all my spectrometers with them to an accuracy typically of +/- 1 nm.
Thanks again for your very useful comments,
Steve
Dear Steve,
Thank you for your kind response. Just a quick update regarding halogen spectrum tubes. With a transmission diffraction grating (1,000 lines/mm) covering the objective lens of my night vision scope, I count six bright molecular emission bands from Cl2 or Cl2+ gas floating above the layer of blue CsCl salt crystals. These are almost certainly the same six bright lines that you saw with your set-up. I had hoped to determine the bond energy of the molecule responsible for the emission, thereby identifying it, using the Birge-Sponer procedure that you discussed in your great articles on the I2 absorption spectrum. Unfortunately, I don’t have sufficient information about the vibrational energy levels of chlorine gas. So, I had to try something more low-tech. Fortunately, I have electrodeless spectrum tubes for F2, Br2, I2, and KI. My thought was that perhaps the gas in the atmosphere above CsCl could be identified by comparing and contrasting the behavior of these other tubes with the CsCl tube. The F2 tube doesn’t light up at all, presumably because of F2’s unmatched ability to scavenge up free electrons, thus blocking an electrical discharge from forming at all. The Br2 tube glows whitish, with the internal surface of the tube fluorescing an apple green color, probably due to strong UVC emission from Br atoms in the discharge. Also, the light emission from Br2 is rather poor, and the spectrum just looks continuous. The I2 tube is pretty spectacular – very bright, white light with a continuous spectrum. The KI tube has a sort of dirty, off-white, fairly bright glow with a continuous spectrum, suggesting I2 vapor, since F2 and Br2 are ruled out due to their unique behaviors. Also, K has a strong emission line in the NIR, which the night vision scope would have easily detected, so again we are back to I2 vapor. Based on how I2 and KI tubes behave, it appears that metal halide salts decompose in a Tesla field to provide a thin atmosphere of the halogen element that was originally present in the salt, which is the same conclusion that you reached from your experiments with KI and tin iodide tubes. While not totally conclusive, and merely arguing by analogy, these tests do suggest that Cl2 gas is the emitting species in the CsCl tube. Like you, I also saw no color change of the salt in the KI tube, but I was able to get it to turn a brownish color by using a scary Tesla coil that makes loud and snappy blue-violet lightning bolts several inches long! Finally, it just occurred to me that the classical method of producing small amounts of Cl2 gas in the laboratory – heating some CuCl2 salt in a test tube in a Bunsen flame – is basically what we are doing with these salty vacuum tubes. CsCl, KI, and tin iodide take the place of CuCl2. A Tesla coil replaces the Bunsen burner. The appropriate diatomic halogen gas forms easily once a sufficient level of energy is applied. And instead of reducing Cu+2 ions to Cu+, we are driving electrons into the bulk of the salt itself, forming F-centers or color centers. Respectfully, Gerry Francisco.
Dear Steve,
I think this may finally answer the question as to the identity of the gas above the CsCl salt layer. I found two free but old scientific papers in pdf format online over at Royal Society Publishing (The Emission Band Spectrum of Chlorine – I & – II). These suggest a recurring spacing between spectral lines of about 630 cm^-1. I converted the nine wavelengths that you found in your spectrum to wavenumbers (I could only see the six brightest of these with my set-up, extending from visible violet to visible deep red), subtracted the adjacent wavenumbers from each other, divided each difference by two (perhaps there are actually 18 bands in the spectrum, twice as many as actually observed, the “missing bands” being forbidden due to quantum mechanical selection rules?), and finally took the geometric average of the resulting eight half differences. This gives 637.5133 cm^-1, pretty close to 630 cm^-1. I don’t know if this process is legitimate, but it is very interesting that your data very nearly give back the same vibrational spacing found in the old papers mentioned above. It looks to me like the unknown gas is Cl2, and the spectrum is due to Cl2+, which makes sense, since the Cl-Cl single chemical bond is quite strong, and the environment inside of a spectrum tube is quite ionizing. Great job on inspiring home experimenters everywhere to keep on trying! Respectfully, Gerry Francisco.
Dear Gerry,
Many thanks. I have found the 1936 paper. And it’s from my old Alma Mater where I did my first degree!
It will make a fascinating read. I’ll go through the paper and get back to you soon. Thanks for all your comments and explanations too.
I have an old chlorine gas spectrum tube so I will take another look at that as well, both with an HV supply and a Tesla coil. The tube has metal electrodes so I’m not sure as to the quality, presence of contaminants, moisture and so on.
I also have some initial results on the visible light spectrum of Br vapour in absorption. I haven’t yet written anything on my blog about this (too many other projects going on atm). However the absorption profile and envelope is very similar to that for Iodine. If you like, I’ll send you an email with some images and spectra.
best regards
Steve
Dear Steve,
Yes, I am very interested in all things halogen, whether emission or absorption!
Also, do you have spectra for the sulfur, ammonia, alcohol, and CO2 spectrum tubes? Your spectrum tube article had great shots of all of the energized tubes, but only some of the spectra were shown. I’m really interested in the less common tubes, because I am not familiar with their spectra. Tubes like neon and hydrogen steal all of the press. I have reached a point where I am considering making my own tubes: just fill up an empty glass jar with the gas of choice, spark it with one of those plasma candle lighters, and see what kind of a spectrum I get!
Respectfully,
Gerry Francisco
Hello Jerry,
I do have additional spectrum tubes for the compounds you mentioned, but I cannot speak as to their quality (potential moisture ingress, contaminants, etc… during production). I will send you their discharge spectra in a private email message soon…
I am not sure you will have much success in fabricating your own tubes, but I do wish you good luck in that particular endeavour. “Just filling an empty glass jar and sparking it” is unlikely to work. Most commercial spectrum tubes are made to strict specs under high vacuum conditions during the gas capture and sealing process. And even then the manufacturers cannot guarantee that all moisture, for example, has been eliminated – hence the appearance sometime of the H-beta emission line at 6563 Angstroms. But I do wish you good luck! I am not an expert in this area.
Dear Steve,
I will let you know how the DIY spectrum tubes work out. I thought I would start with oxygen, since I have a small tank of this gas, as well as an electrodeless Tesla-type O2 tube to compare with. These will basically be atmospheric pressure experiments, so I am not sure what that will do to the spectrum. The idea is to fill up a vessel with the gas by air displacement, apply high voltage to a spark gap within the chamber, and start looking! Thank you for your kind words of encouragement!
Any spectra you could send regarding the more odd ball gases would be much appreciated, as they would provide valuable comparison spectra.
The O2 Tesla spectrum is very interesting. 2 green lines, which are apparently molecular bands, and a yellow-orange, a red, and 2 NIR lines (777 & 845 nm, both very intense!), which are all apparently atomic.
I have always wanted to try making my own high-pressure spectrum tubes, but you are right – the idea may not work. The plasma arc of a candle lighter may have a great deal of current, which may simply heat the gas to incandescence, much like what happens in a xenon flash tube.
Respectfully,
Gerry Francisco
Hi Jerry,
Do you have a website or blog where I could take a look at some of the spectra you are seeing? Any photos of your experimental setups that you could share?
Regards
Steve
I have done a lot of molecular spectroscopy many decades ago. Since my retirement I started building spectrographs doing spectroscopy with many glas tube filled with CO, CO2, N2, O2, N2O H2, D2 etc, with tesla generators, whatever I can do at home
The spectrum above shows emission lines from molecular CO, the so called Angstöm Bands. You will find theme everywhere in literature. These molecular band ars asymetric, degraded to the blue. This depends on wheter the upper electronic level has lower or higer distance bewteen both atoms.
By excitation with a tesla generator the CO2 is cracked to CO and O. So you see CO bands an also O Lines (e.g.777,844nm).
I have just bought a glas tube with CsCl from Smart Elements to do some spectra.
Hello Franz,
You are probably right about the lines being the Angstrom bands. Wavelength assignments and intensities fit this spectrum very well in the region 450 to 600 nm. What is a surprise to me is that I didn’t expect molecular CO in what was described as a sample of caesium chloride crystals prepared under vacuum, according to the Smart Elements website.
Traces of moisture/CO2 during preparation of the tubes, possibly. If you are ordering a sample from Juergen Bauer at his company, you could ask him if contamination by moisture or air is a possibility during tube fabrication.
Steve
I would not believe in everything posted in the description of some Smart Elements tubes.
e.g. my tube with 70%N2/30F shows about 40 bromine atomic emission lines between 400 and 850nm excited with a tesla generator.
I have asked some questions about the production process of their tubes in the past. They were very reluctant in giving answers.
I´m waitig for the delivery of the CsCl tube.
I have checked many tubes with N2, H2, D2, O2, CO2, N2O, H2O. Usually beside the main lines you see some N2, N2+ bands, most probably due to unperfect evacuation.
Franz
I’m beginning to think you are right! I also have the Smart Elements fluorine/nitrogen tube but I have not had the opportunity to look at the emission spectrum yet. I will get to it soon and let you know if I see any bromine lines.
Last year I ordered their so-called “super-bright” Kr discharge tube, but I have never been able to get it to work, neither with a Tesla nor with a high voltage power supply.
Dear Steve,
I have some photos I can send you (some emission spectra [such as iodine & chlorine], some shots of my equipment, and a nice shot of fluorite emitting the blue glow Eu+2 cation under 405 nm violet diode laser excitation). I think it’s safe to say that your toys are much cooler than mine! Do you have an e-mail address I can send the photos to? I, too, have had trouble with spectrum tubes over the years; hence the interest in making my own.
Respectfully,
Gerry Francisco
I have sent you an emaill address where you can contact me…
Regards
Steve