In a recent post, the infrared (IR) spectra of a series of common organic solvents were recorded, obtained with an FTIR spectrometer and an ATR accessory. An explanation of the different types of fundamental molecular vibrations was provided and then these vibrational modes assigned to the different absorption bands seen in each IR spectrum.
In this article, we move on to consider the Raman spectrum for these same solvents. If you are not familiar with the Raman Effect or Raman spectroscopy, then this is a useful introduction. And this article describes a practical experimental technique that can be used to take a Raman spectrum.
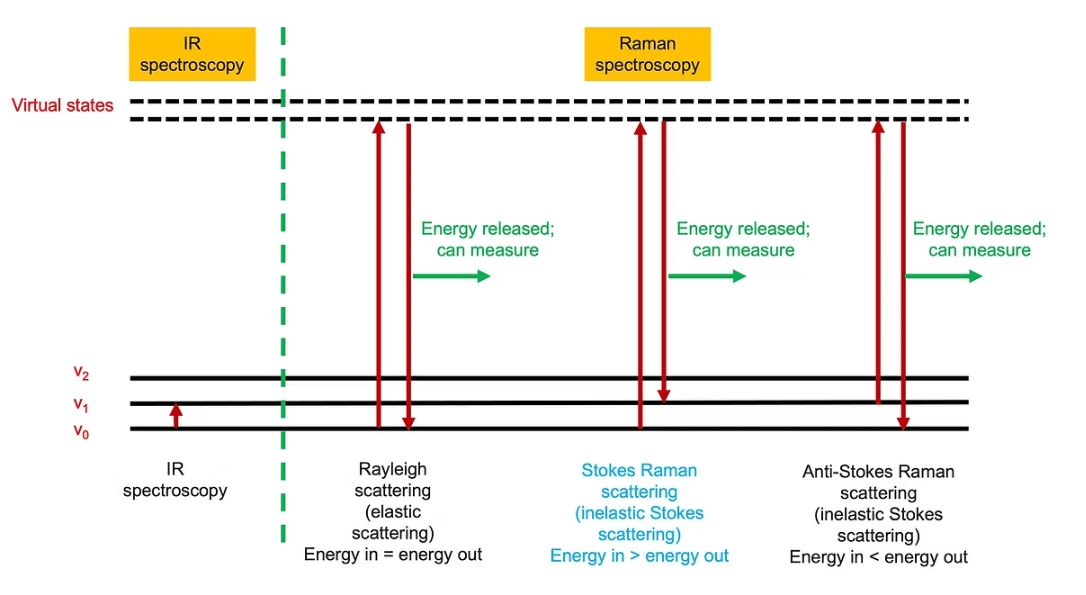
In addition to the above links, a quick reminder of the Raman effect, the energy levels involved and how it differs from infrared is summarised in this schematic:
Energy transitions involved with Raman Scattering and Infrared
There is a fundamental difference between infrared (IR) and Raman spectroscopy, although in the end both methods measure changes in the vibrational energies of bonds in a molecule and produce a vibrational spectrum.
The Raman effect is a scattering phenomenon. It is usually explained by having photons of light from a laser (most often at visible or near IR wavelengths) striking a molecule. When these laser photons impact with the electron cloud of one of the molecule’s chemical bonds, which are vibrating at a specific frequency, they can cause the laser light to be shifted in energy (therefore wavelength or frequency).
The bond is often depicted as being excited into a virtual energy state as in the energy level diagram above. This virtual energy state is unobservable and is not a real, stationary quantum state (an eigenstate) of the molecule. It is an extremely brief (10-15 sec) distortion of the molecule’s electron cloud by the photon that the system undergoes during the interaction. Almost immediately, the system relaxes to a real energy level, then emits a scattered photon.
The energy difference of the Raman scattered photon corresponds to different energy gaps in the molecule’s vibrational energy levels. The photon can be scattered elastically (Rayleigh scattering) or inelastically (Stokes and anti-Stokes scattering). More information of the process is provided in this article.
In contrast infrared spectroscopy, shown on the left in the above diagram, involves a true absorption process, with an infrared photon being absorbed by a molecule, and increasing its vibrational state and energy, v0, v1, v2 … being the vibrational energy levels.
Infrared or Raman - Which to Choose?
Both IR and Raman spectroscopyprovide information about how molecular bonds vibrate when interacting with light.So when it comes to obtaining the spectrum of a sample, which one do you choose, Infrared or Raman?
In reality, the two methods nicely complement each other as a means to describe the vibrational characteristics and features of a molecule. As a general rule, although this is not always the case, a molecule that exhibits strong vibrational band absorptions in the IR will have fairly weak absorptions in its Raman spectrum. Conversely, one that possesses strong vibrations in a Raman spectrum, will generally have correspondingly weak absorption peaks in the IR.
Aqueous samples can be difficult to analyse with IR methods because the presence of water produces strong and broad stretching and bending O-H vibrations. We saw this with the IR spectra of various alcohols in this recent post. But with Raman, water is only a weak scatterer, so samples containing moisture such as water-based creams, gels and pastes can be analysed quite well.
Generally, IR is better when examining compounds that have chemical bonds with a strong dipole moment, such as O–H, N–H and C=O, whereas Raman is useful for studying bonds that are not quite as polar but do possess a readily polarizable electron cloud. Examples are C–H, C–O and C–N. When used together, both techniques are able to provide molecular structure information in order to fully characterise the vibrational behaviour of a sample.
We now move on to examine the same organic solvents measured earlier by FTIR spectroscopy, but this time by the Raman technique.
Raman Spectra of Some Simple Organic Molecules
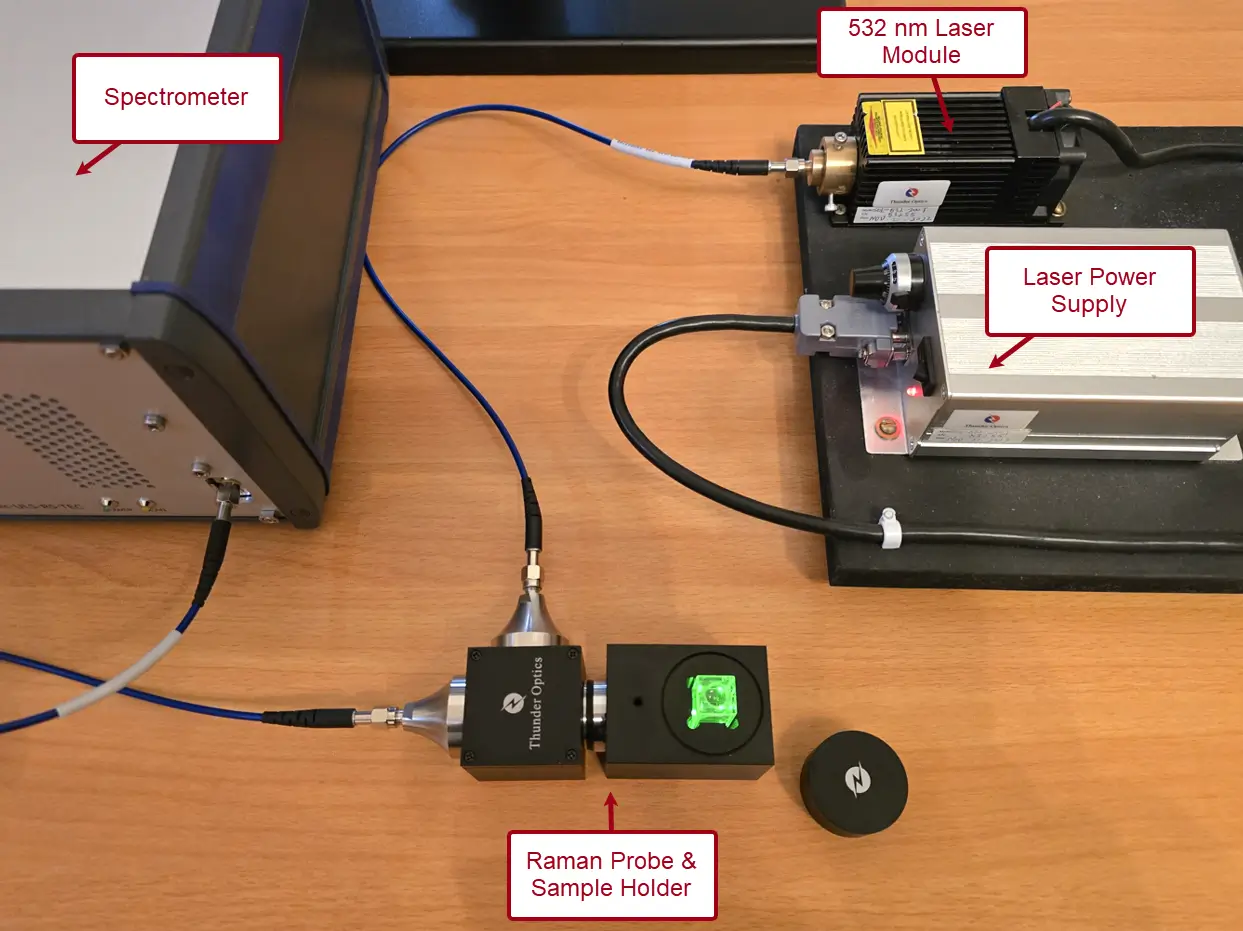
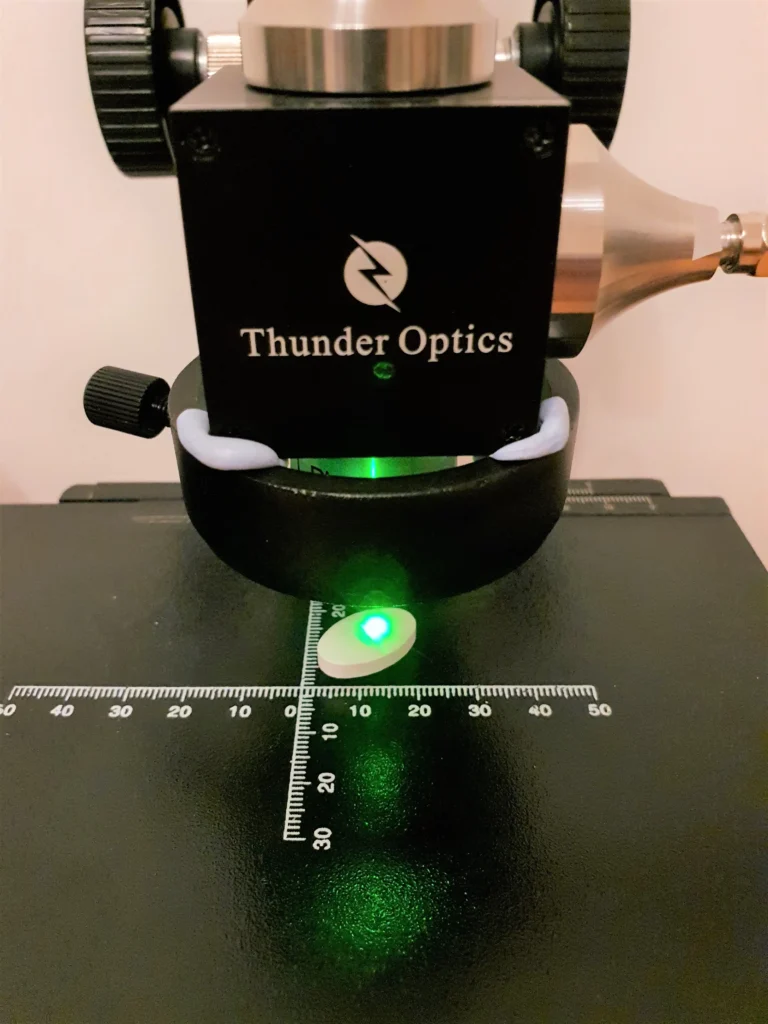
All spectra were recorded using a Thunder Optics Raman probe with a 532 nm laser described here. The basic experimental setup is shown here:
Pure samples (≥ 98.5%) of each solvent were added to a 1 cm quartz cuvette and the Raman spectrum recorded. Data acquisition times varied, but all were less than 5 seconds. Acquisition was directly controlled using the “Acquire” function in the free Spectragryph software and the spectra were background corrected.
n-Hexane
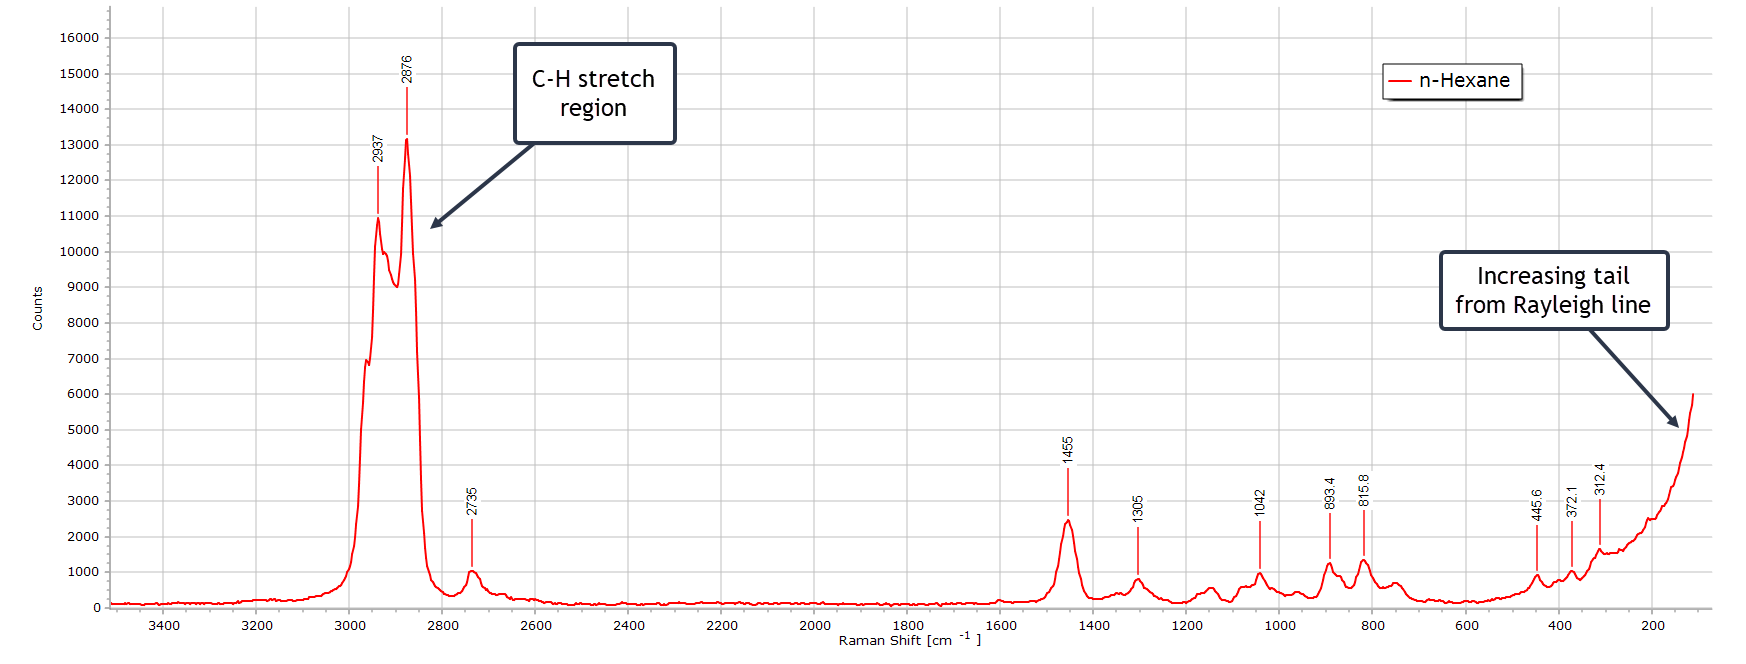
This is a very typical spectrum of n-hexane (C6H14) recorded at 532 nm. The band positions and relative intensities are fully consistent with a linear alkane in the liquid phase.
There is the very strong C-H stretching region from ~ 2850 to 2960 cm-1 as expected for a saturated hydrocarbon. The strongest band of this group is the symmetric CH3 stretching vibrational mode which is one of the strongest Raman peaks in linear alkanes.
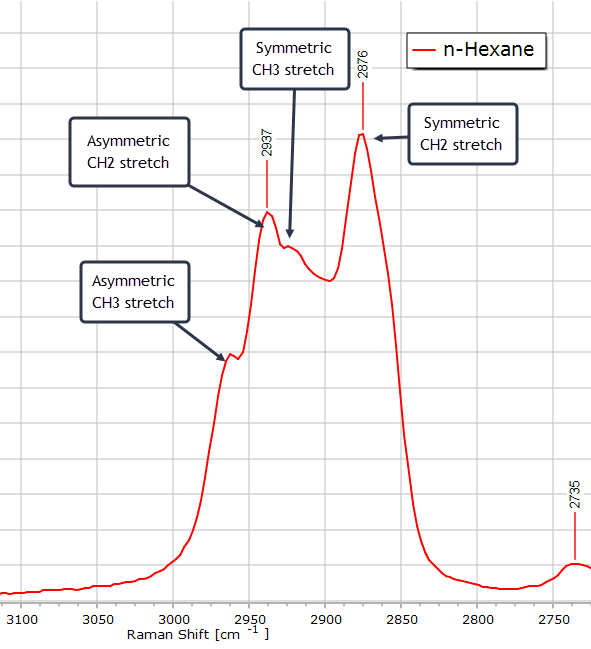
If we zoom in on this envelope of peaks, we see the CH2 symmetric stretch peak at 2876 cm, the methyl CH3 symmetric stretch mode as a shouder on the methylene CH2 asymmetric peak, and the asymmetric stretching mode of CH3 at about 2965 cm-1.
There is a well defined CH2 bending (scissoring) peak at 1455 cm-1 and several weak bands in the region 1300 – 800 cm-1 from various CH2 twisting and wagging vibrational modes. There are also a couple of weak C-C-C low frequency bending vibrations below 500 cm-1 but these become distorted somewhat by the rising Rayleigh line from laser scattered light.
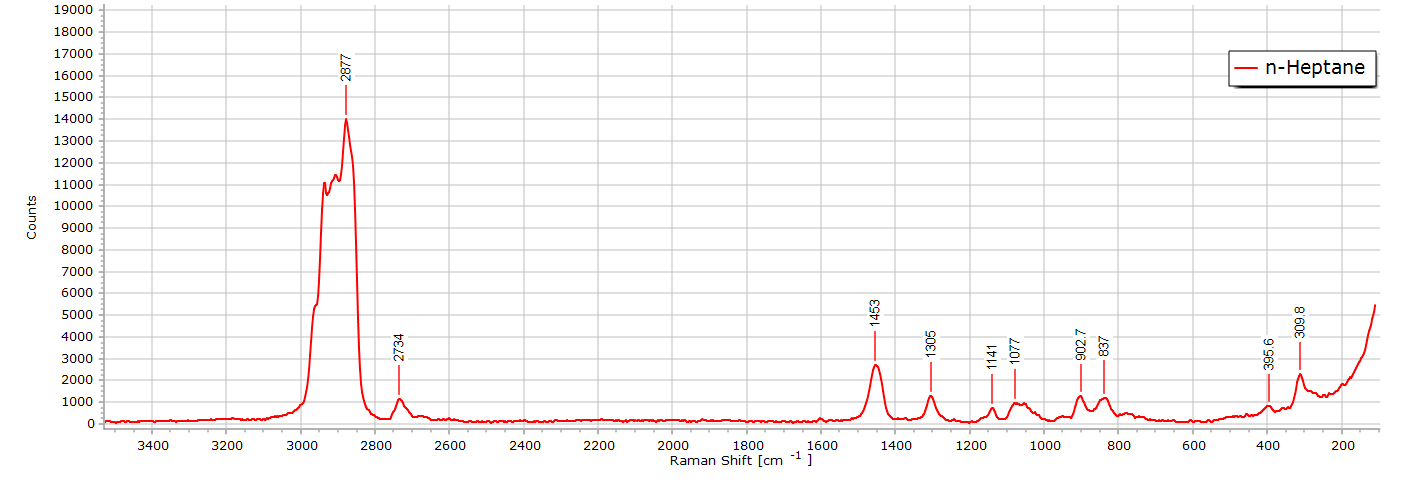
n-Heptane
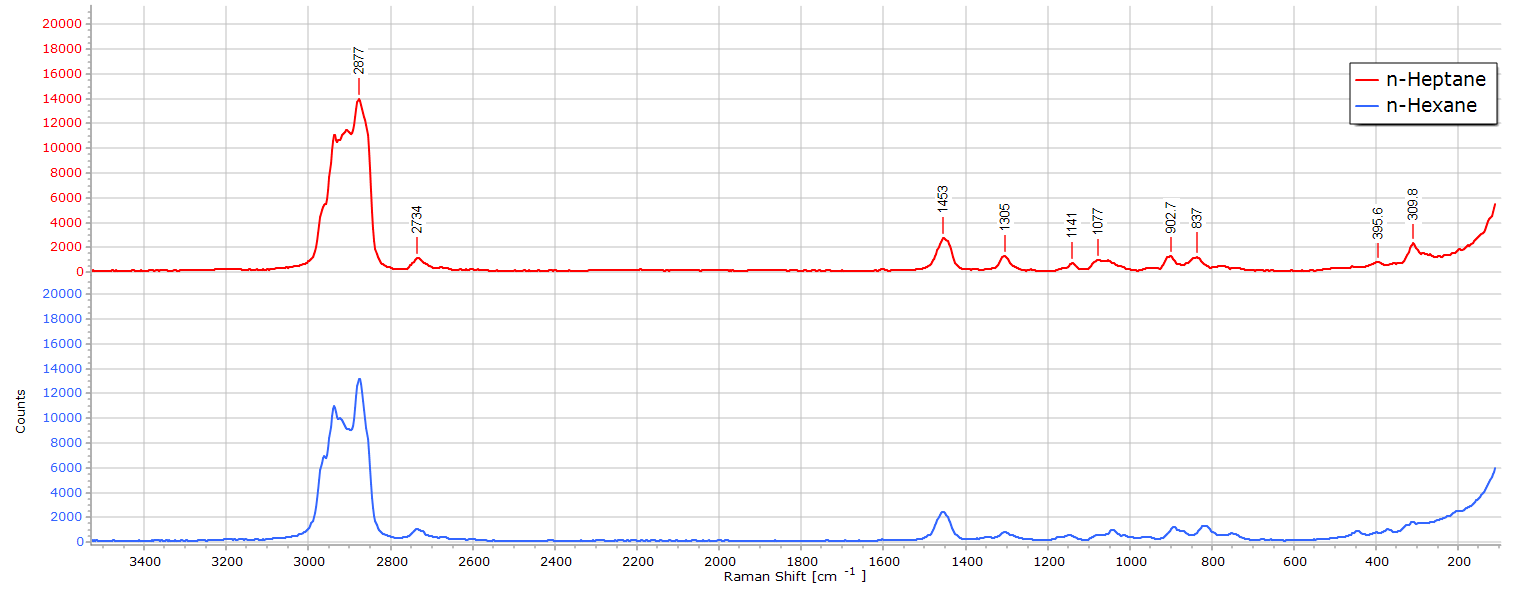
The Raman spectrum of n-heptane (C7H14) is almost identical to that of n-hexane. After all, we are only dealing with one additional CH2 group in the molecular chain length. There are, nevertheless, some subtle differences. If we stack the two spectra in software they appear almost the same:
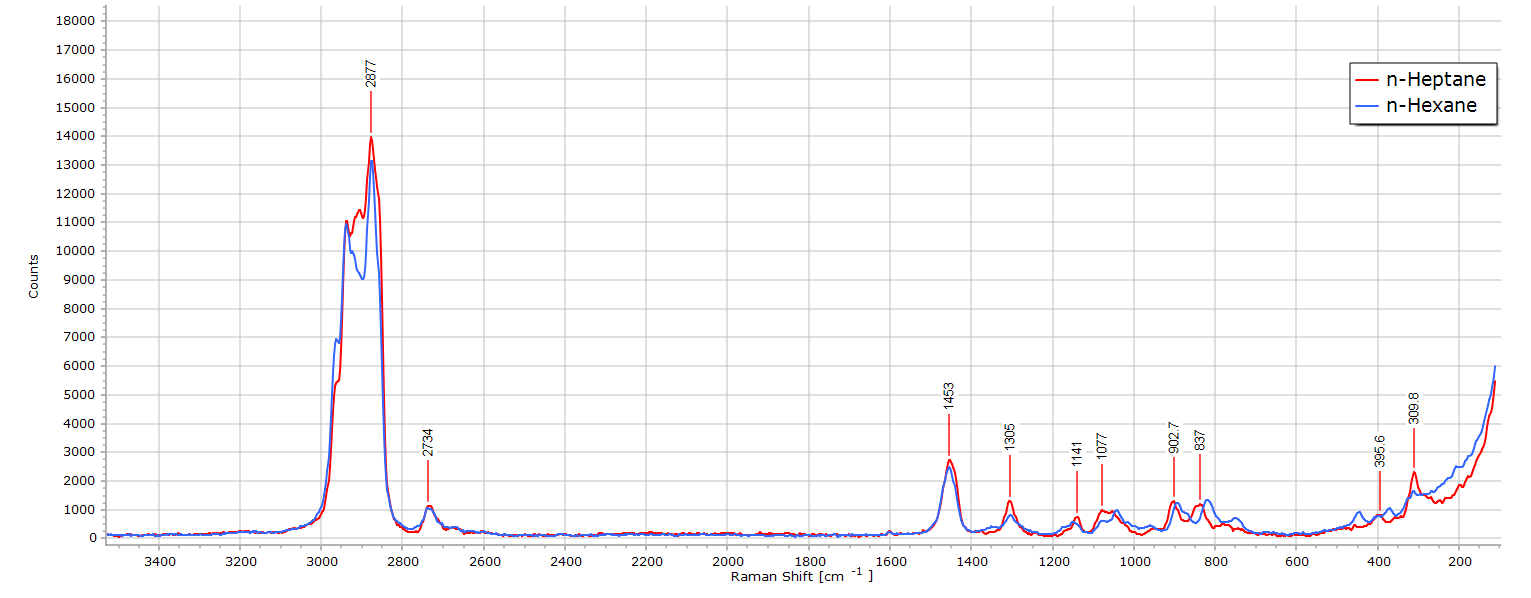
Superposing the spectra begins to reveal some differences:
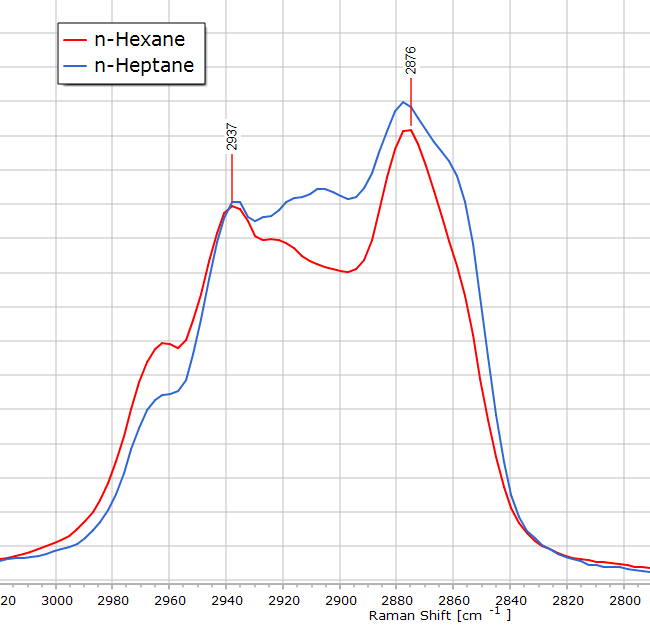
And these difference are best revealed in the C-H stretch region, when zoomed and expanded:
Spectroscopically, this means there is a slight increase in —CH2— band intensity owing to the greater contribution that this functional group makes to the molecule. The CH2 asymmetric stretch region
Acetone
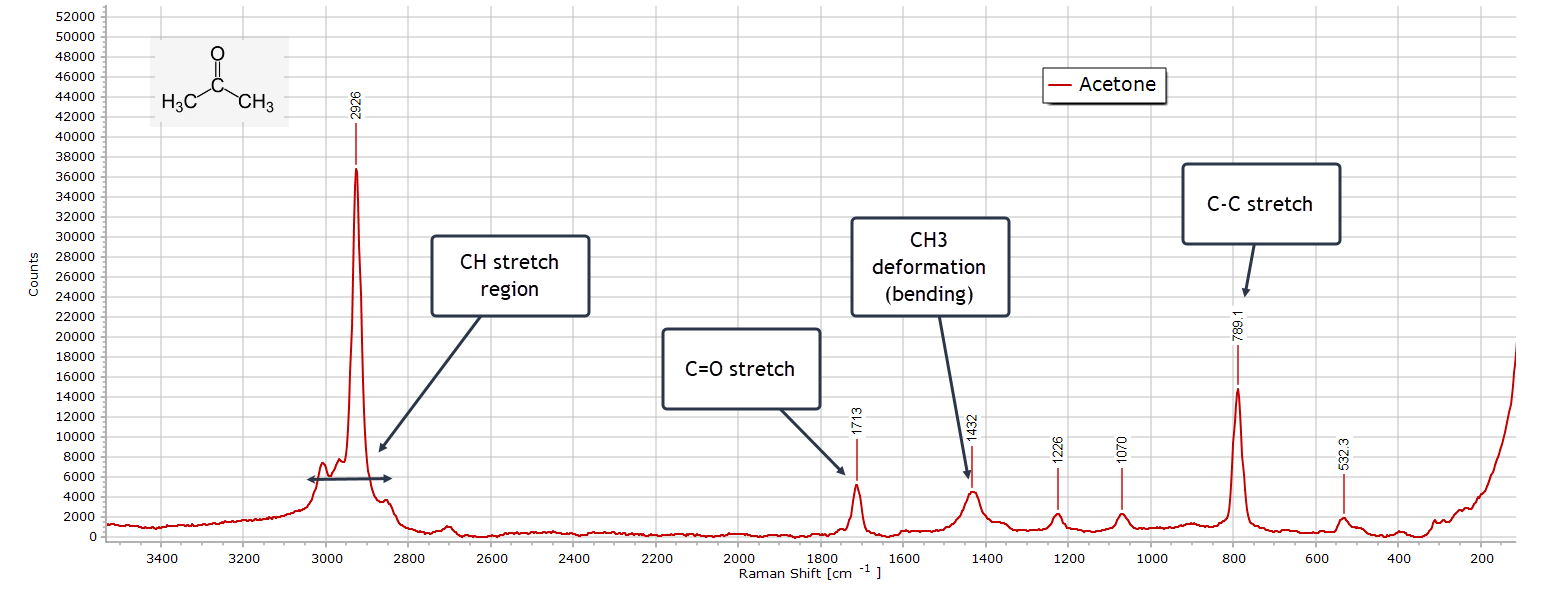
The Raman spectrum of acetone exhibits some distinct differences when compared to its IR spectrum. Consider first the carbonyl peak at ≈ 1710 cm-1, which is always a good diagnostic feature for any ketone. Here, the C=O stretch absorption is quite weak in the Raman spectrum; in the FTIR spectrum this peak is extremely sharp and intense; in fact it is the strongest peak in the entire spectrum. This is because there is a large dipole moment change during the C=O vibration in the IR, but only a very modest change in polarizability in the Raman spectrum.
Moving on to the C-H stretch region, this is dominated by the strong symmetric CH3 vibrational stretching peak originating from the two equivalent methyl groups. There are additional asymmetric and symmetric stretching vibrations from CH3 that appear as shoulders around the strongest peak. In the IR, all these C-H peaks are very weak.
Turning to the methyl (CH3) bending (deformation) region, typically 1500 − 1300 cm-1, both spectroscopies produce strong peaks, since they involve appreciable changes in dipole moment and polarizability.
In the Fingerprint region, from around 1250 − 70 cm-1, a strong C−C−C skeletal backbone stretching mode is present as the two methyl carbon atoms stretch relative to the carbonyl carbon atom.
Methanol
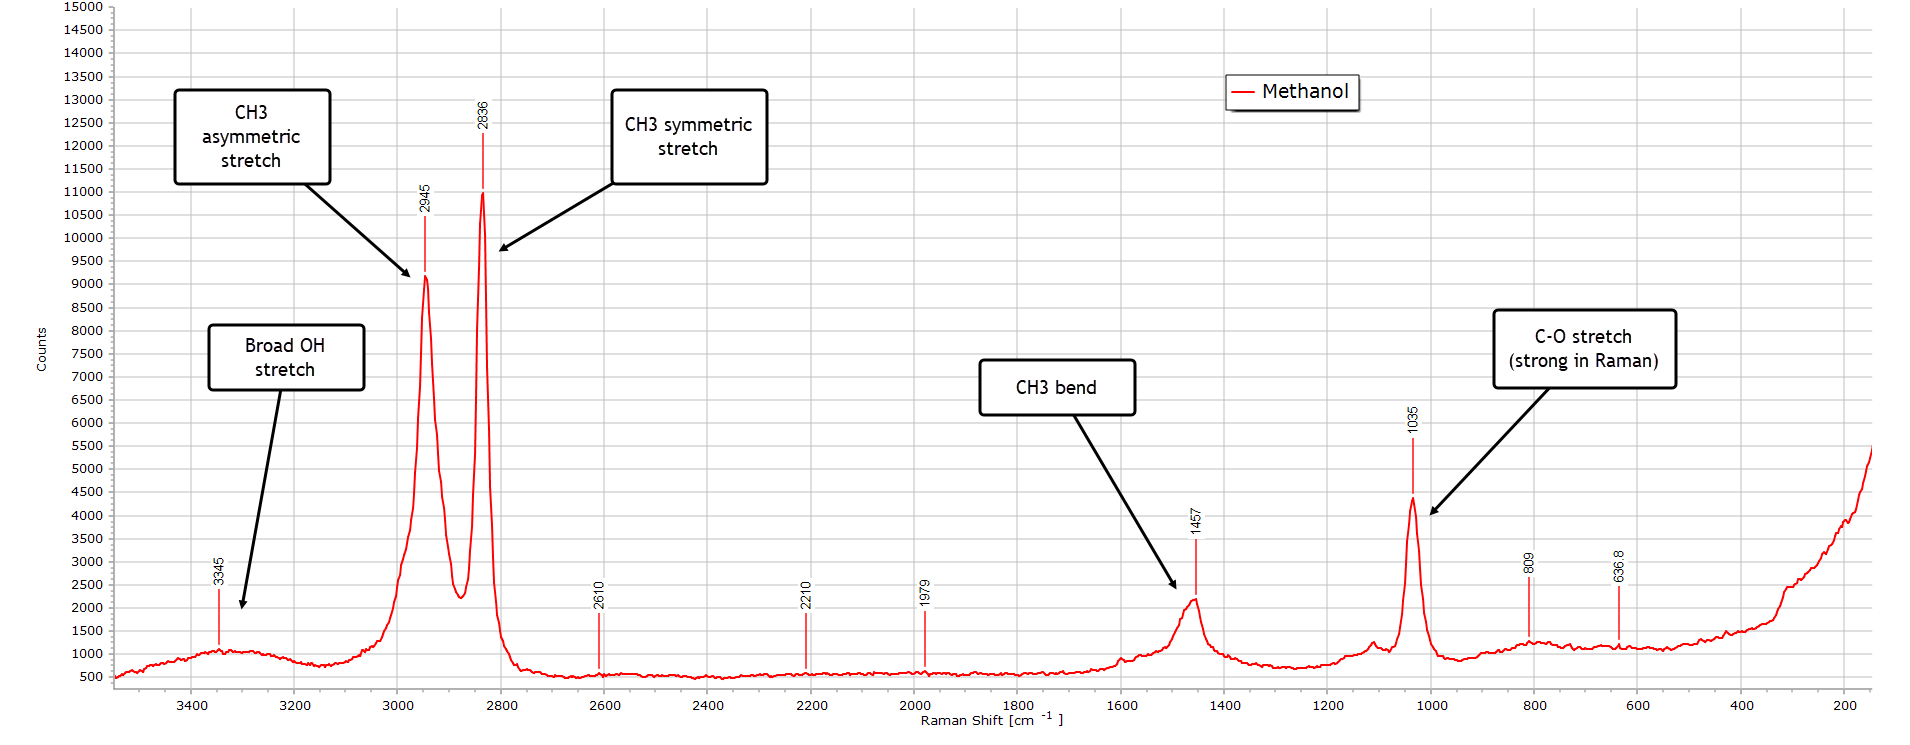
Moving on to methanol, the simplest of the alcohols, this is its Raman spectrum:
There is a very broad but weak O-H stretch frequency band peaking around 3300 cm–1 which is much stronger in the IR spectrum. This is the O-H stretch vibrational band. It is still present but relatively weak relative to the same IR spectrum, since O-H vibrations produce a much stronger dipole moment change and therefore signal) relative to a change in polarizability. There is a strong asymmetric stretch mode at about 2836 cm-1 and is due to the symmetric stretch vibration of CH3, highly Raman active owing to a large change in polarizabilty.
And the strong peak at around 1035 cm-1 is usually one of the stronger peaks and is due to a C-O stretch vibration characteristic of methanol.
All in all, the Raman spectrum of methanol is relatively simple.
Ethanol
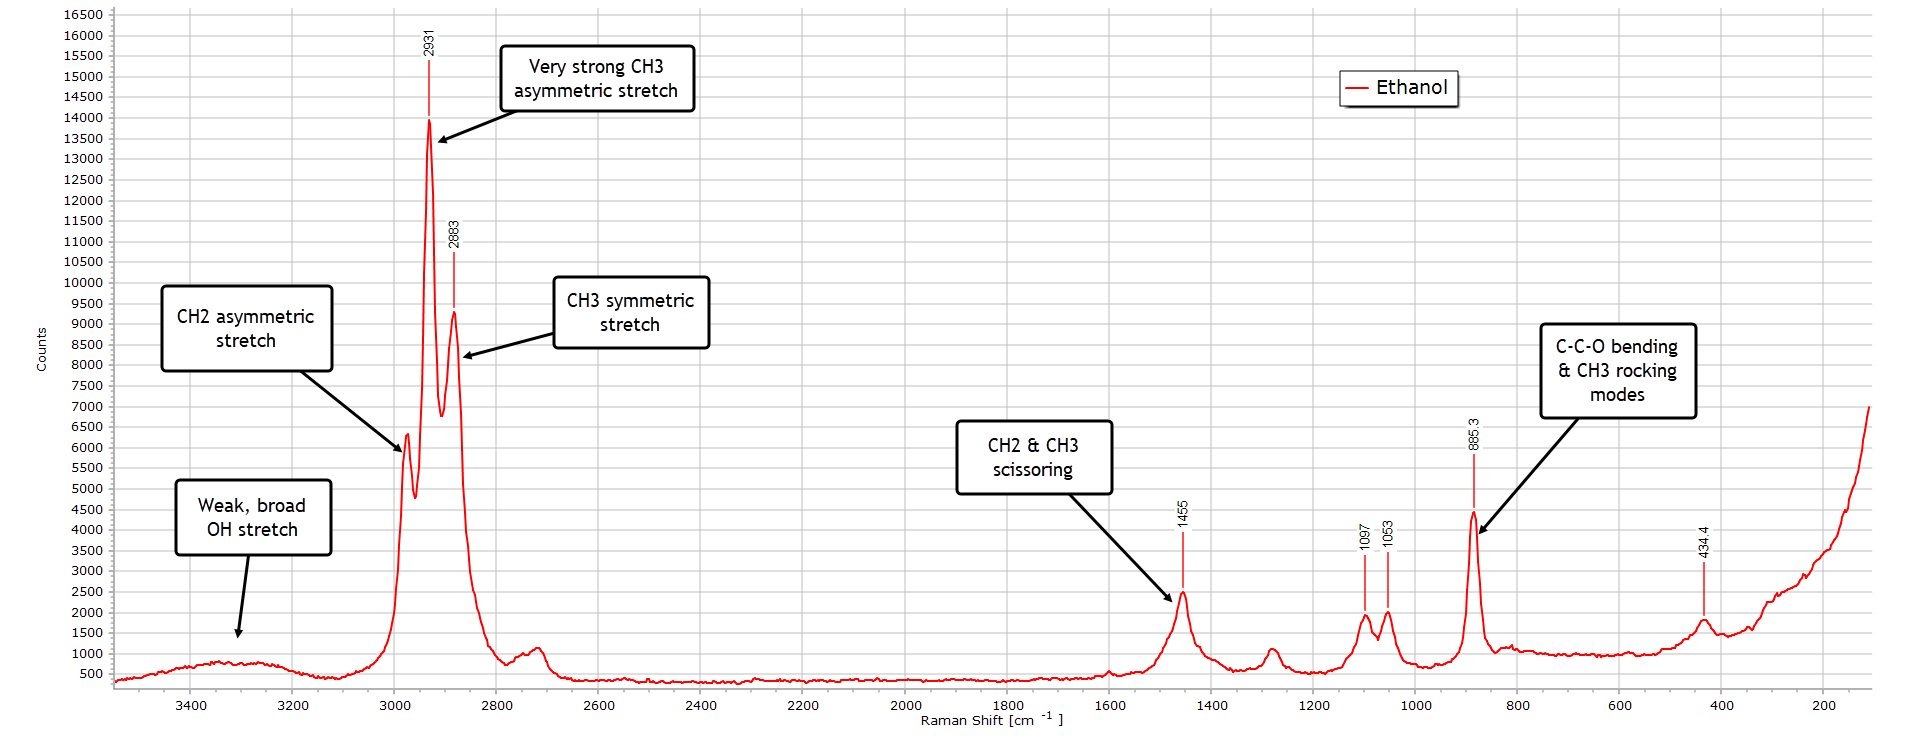
With ethanol, with only one methylene (CH2) group longer than methanol, we see an overall similar Raman spectrum, but there are some differences, largely due additional modes of vibration that this extra group adds to the C−C−O backbone.
The O-H stretch region around 3300 cm-1 is broad and weak as with methanol. The much more intense C-H stretching region from 3000−2800 cm-1 is more complex and detailed than with methanol, owing again to the additional methylene group. And we observe more structure in the bending region relative to methanol again due to this extra group.
A strong diagnostic feature allowing us to distinguish ethanol from methanol is the strong C−C−O backbone (skeletal) band at 885 cm-1 which is absent in methanol.
1-Propanol
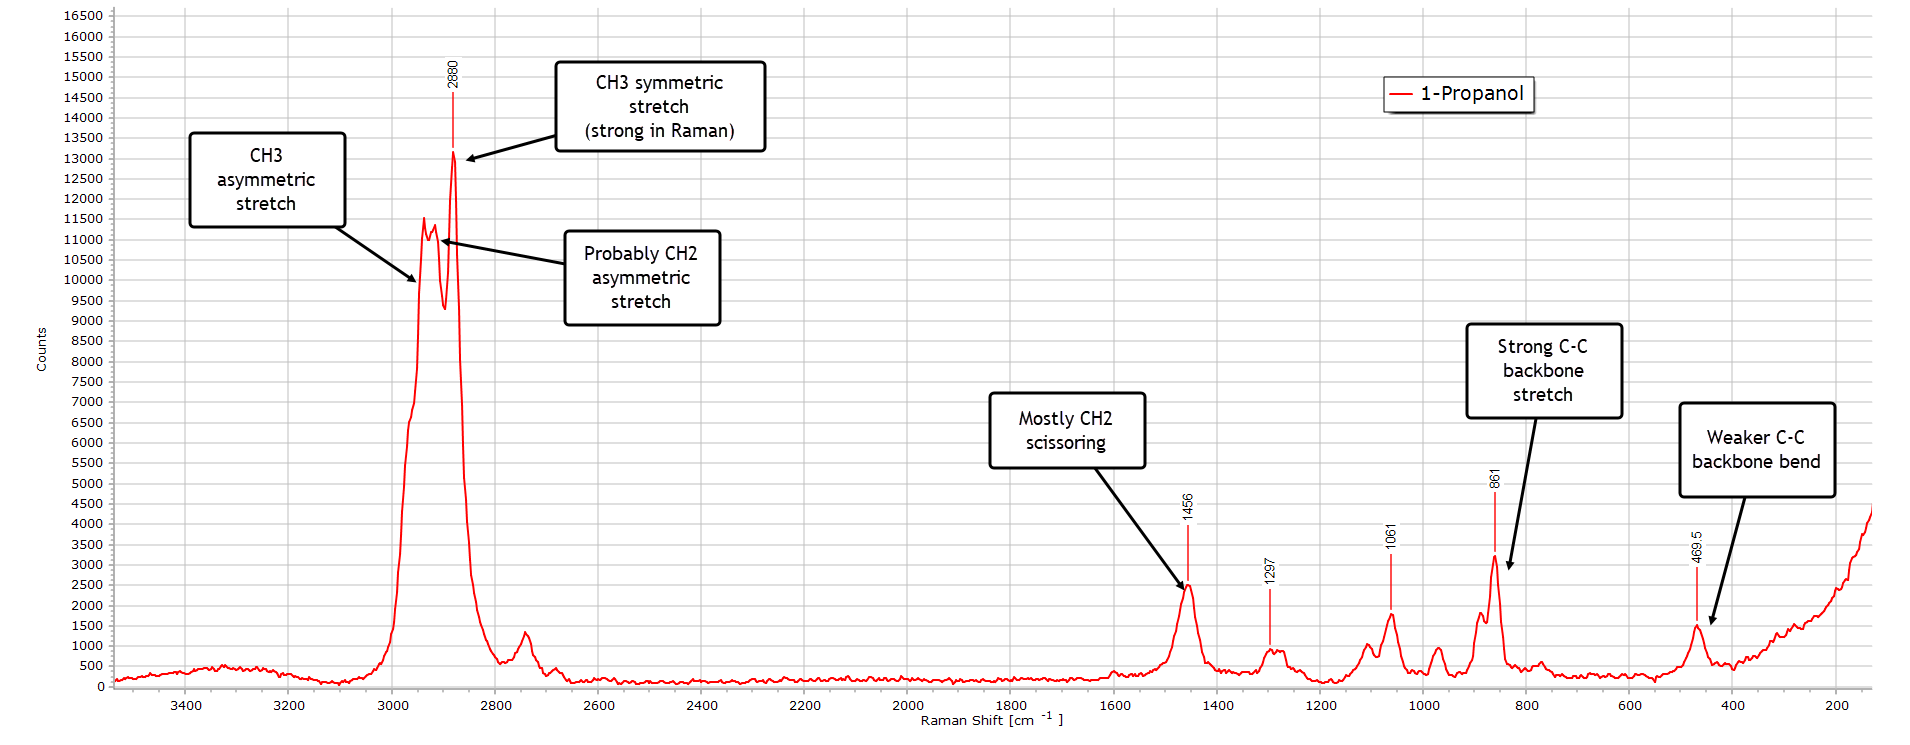
With 1-propanol (also called n-propyl alcohol) things again change somewhat and become more interesting and complex, largely due to the increased chain length:
The weak and broad O−H stretch region is still there as expected, again very much weaker than the same band in the IR spectrum of 1-propanol.
Again, the C−H stretch is the dominant region in the spectrum with a clear multiplet structure. Peak assignments are labelled. The most intense peak at 2880 cm-1 reflects a strong CH3 symmetric stretch vibrational mode, typical of primary alcohols in a Raman spectrum.
In the deformation (bending) region from about 1500−1300 cm-1 the CH2 scissoring mode at 1456 cm-1 is probably the dominant contributor with a minor CH3 bending contribution, explaining why the peak has the broadened shape it has. Because there are now two CH2 groups in the molecule, this peak is quite strong.
In the backbone or ‘skeletal’ region from ≈ 1200−800 cm-1 there a several structured peaks. The peak at 1061 cm-1 (not labelled in the spectrum) is the C−O stretching mode for a primary alcohol which generally occurs between about 1050−1100 cm-1.
2-Propanol
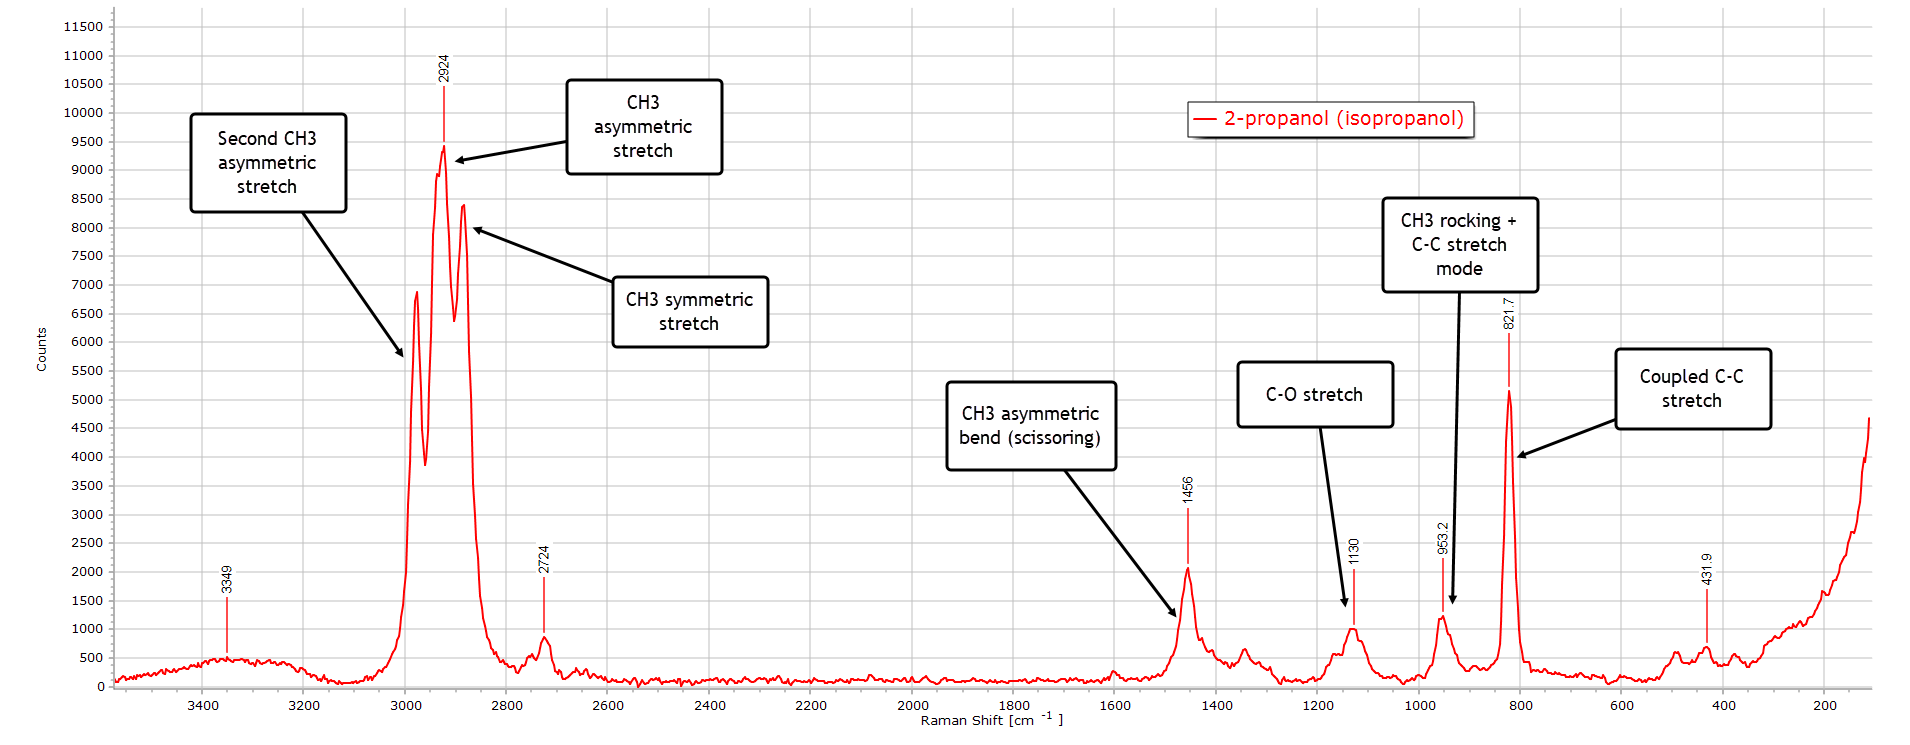
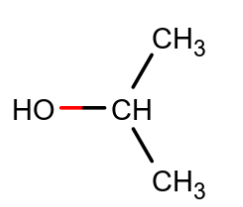
2-propanol (isopropanol) has the formula (CH3)2CHOH and is the first of the secondary alcohols. There is no methylene group in the structure, but there are two “equivalent” methyl (CH3) groups:
As before, we have the broad hydrogen-bonded O−H band around 3350 cm-1, still very weak relative to its IR spectrum.
The strongest peak in the spectrum is the asymmetric CH3 stretch at 2924 cm-1, which also has a strong contribution from the symmetric CH3 modes from the two methyl groups at ~ 2880 cm-1.
The small peak at 2724 cm-1 is most likely a Fermi resonance or combination band, which is present in several other spectra.
In the bending (deformation) region 1500−1300 cm-1 the CH3 asymmetric bend peak is strong since there are 2 methyl groups. The C−O stretch peak at 1130 cm-1 is very visible and the methyl rocking and C−C backbone modes. The strong peak at 822 cm-1 is characteristic for a branched (secondary) alcohol and is a good diagnostic indicator for 2-propanol.
We can summarize all the features and assignments for these four alcohols in the following short tables:
Structure Summary:
Molecule
CH3 Groups
CH2 Groups
Branching
Methanol
1
0
No
Ethanol
1
1
No
1-Propanol
1
2
No
2-Propanol
2
0
Yes
C-H Stretch Region
Molecule
Strongest CH Peak (cm-1)
Type of Vibration
Methanol
≈ 2835-2845
CH₃ symmetric stretch
Ethanol
≈ 2930
Strong CH₂ asymmetric contribution
1-Propanol
≈ 2880
Strong CH₃ symmetric
2-Propanol
≈ 2950-2930
Enhanced by two CH₃ groups
C-O and Backbone Region:
Molecule
Strongest CH Peak (cm-1)
Type of Vibration
Methanol
≈ 1035
C-O stretch
Ethanol
≈ 885
C-C stretch + CH₂ rocking
1-Propanol
≈ 861
n-propyl backbone
2-Propanol
≈ 820-830
Branched isopropyl backbone
Dichloromethane
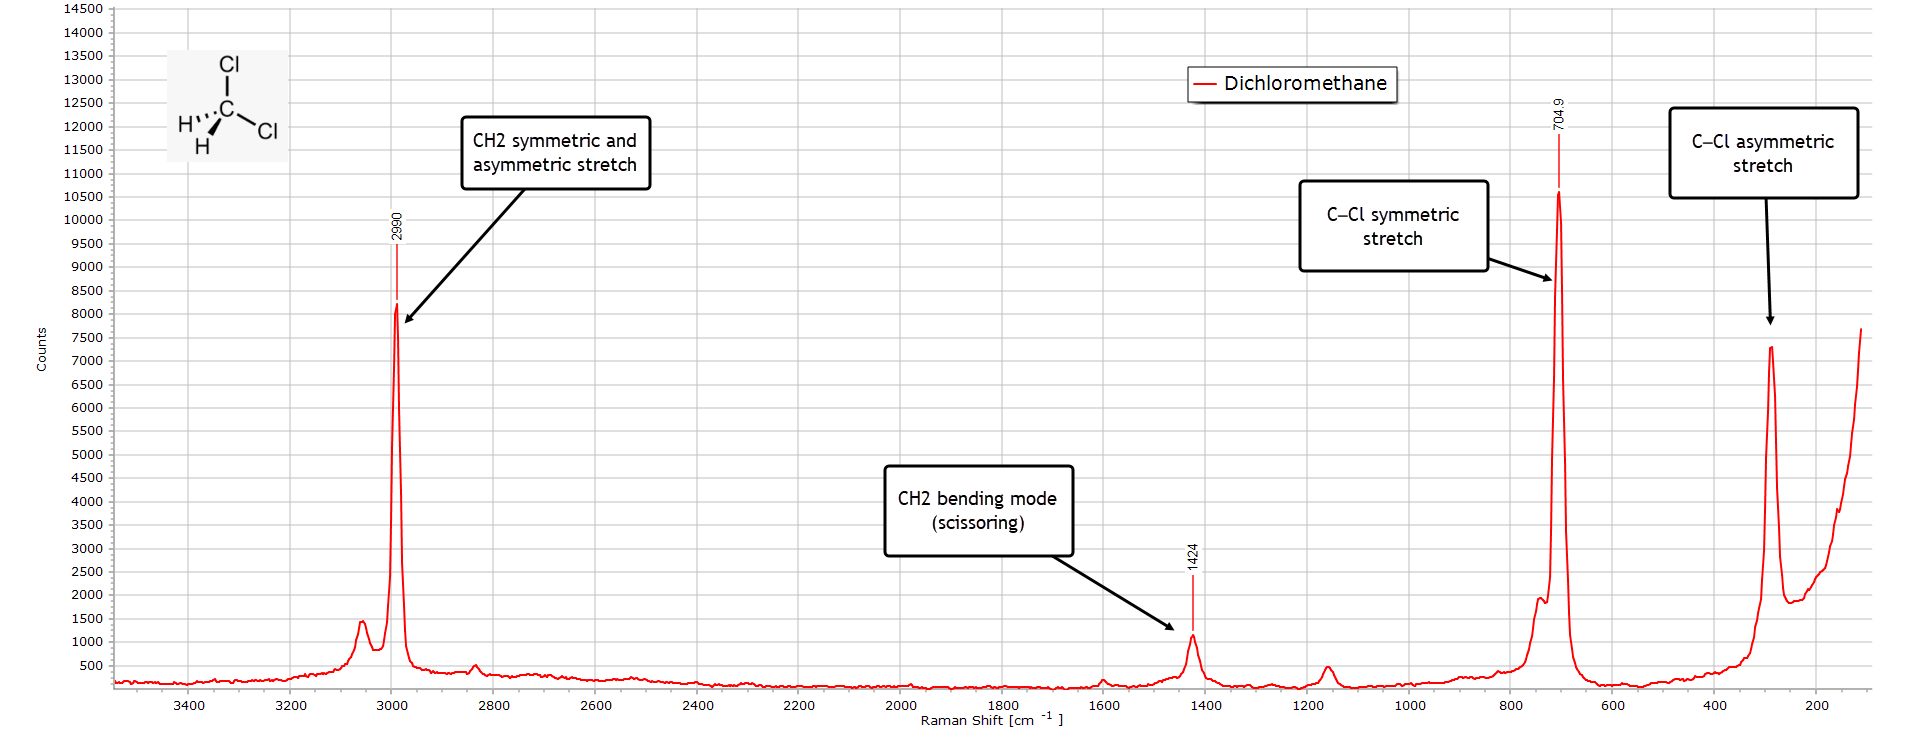
As with the IR spectrum, the Raman spectrum of pure dichloromethane, shown below, is relatively simple from the point of view of characterisation.
The strong peak at 2990 cm-1 consists of both the symmetric and asymmetric stretching vibrational modes of C−H. The clearest diagnostic feature confirming dichloromethane is the very strong symmetric stretch C−Cl peak at 705 cm-1 together with the corresponding asymmetric stretch at about 287 cm-1 which likely includes the Cl−C−Cl backbone deformation.
The weaker peak at 1424 cm-1 is the CH2 scissoring vibrational mode.
Dimethyl Sulphoxide
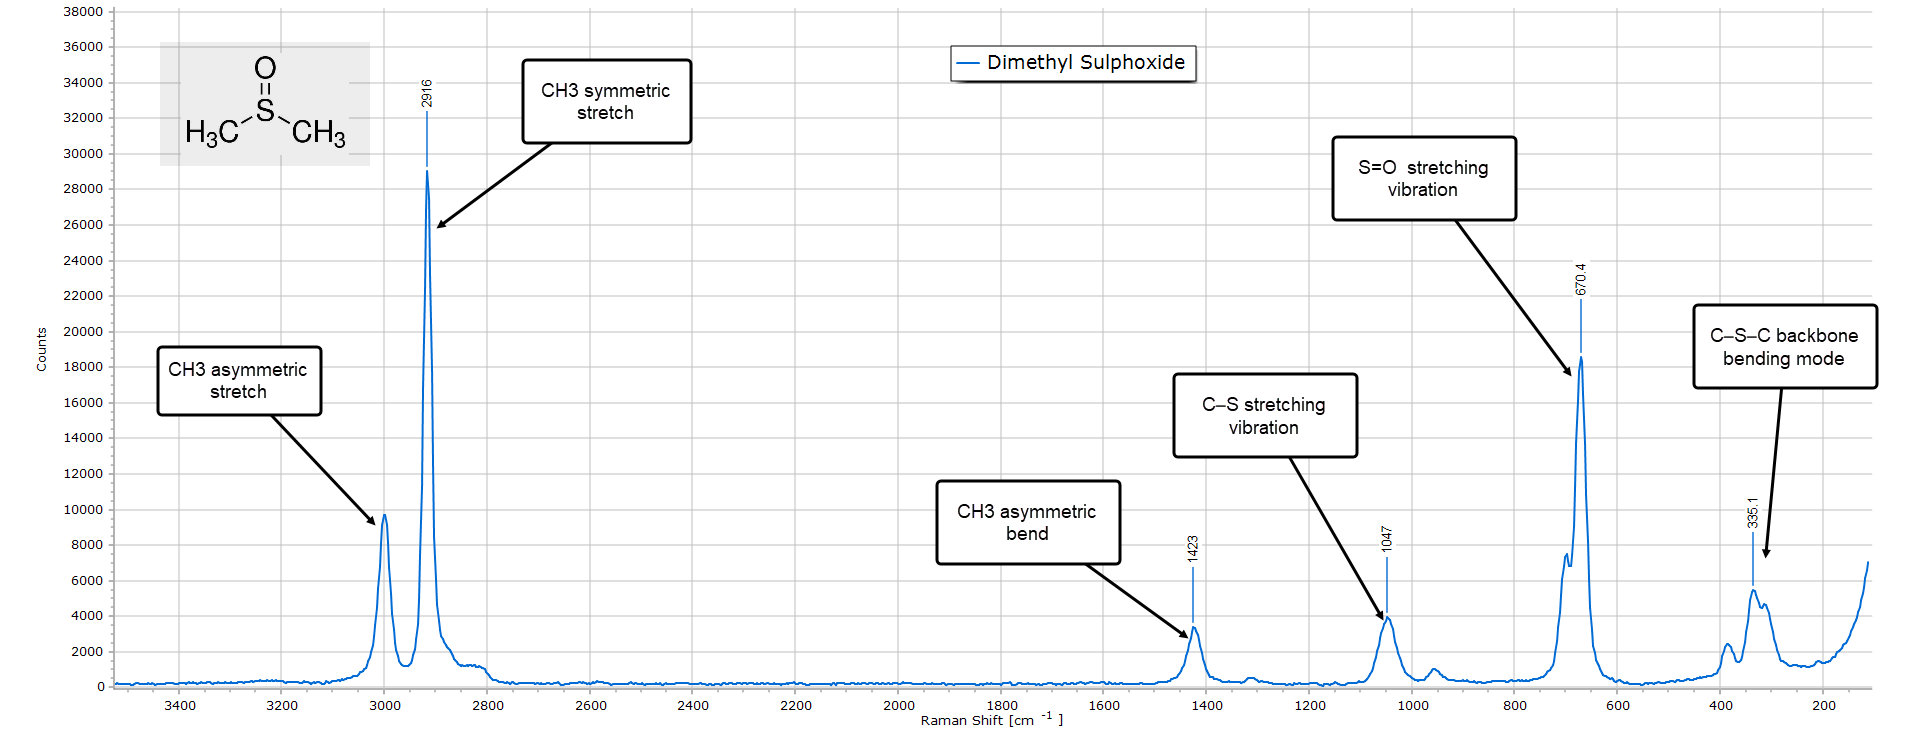
The final example is dimethyl sulphoxide, DMSO. The Raman spectrum is relatively uncomplicated, similar to its IR spectrum.
The key distinguishing features with DMSO is the strong low frequency peak around 670 cm-1 which is due to the double bonded S=O vibration and also the C−S stretching mode at around 1050 cm-1. The presence of two methyl groups means that we should see strong high frequency C−H stretching modes in the region of 3000 cm-1 and this is indeed the case, with an asymmetric CH3 stretching vibration at exactly 3000 cm-1 and a very strong symmetric stretch at 2916 cm-1.
Finally, there is a moderate intensity backbone (skeletal) bending mode around 385 cm-1.
Final Words...
This concludes this short description explaining the Raman spectra of a few simple organic solvents. The post is best read in conjunction with essentially the same article characterising the infrared spectra of the same solvents, which is why links were frequently referenced in the body of the text.
Introduction In a previous post we described the Raman Effect and provided a non-mathematical introduction to some of the basic principles of Raman spectroscopy. The…