Dietary supplements are part of our everyday lives these days. Their function is to maintain a regular daily intake of essential minerals, elements and vitamins, especially as we grow older and our food also becomes more and more processed. But do they contain everything that is claimed by the manufacturer and printed on the label?
In this article we are going to use the natural fluorescence of the vitamin riboflavin (Vitamin B2) to determine the amount in a multivitamin supplement tablet and compare the measured value with what the label on the bottle says it contains.
Riboflavin
Riboflavin (also known as vitamin B2) is a water-soluble vitamin that plays a pivotal role in various metabolic pathways, particularly in redox reactions as a coenzyme. It is important for energy production, cellular function, and the metabolism of carbohydrates, fats and proteins. In addition to its use as a dietary supplement, riboflavin is also used as a food colourant, and in Europe is designated by the “E” number E101.
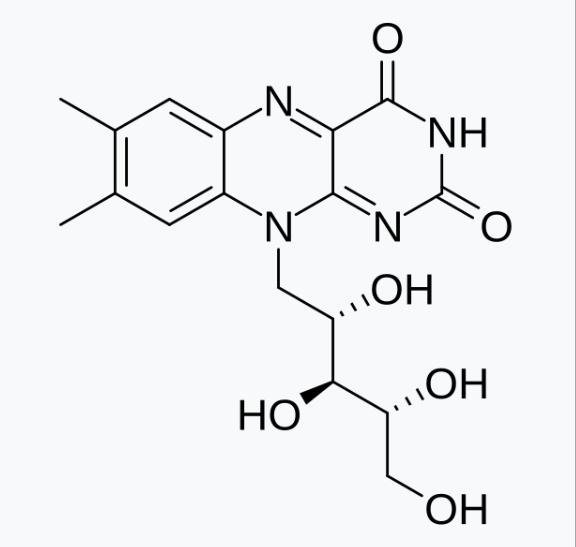
The chemical structure of riboflavin is shown here:
The IUPAC (International Union of Pure and Applied Chemistry) name for riboflavin is 7,8-dimethyl-10-[(2S,3S,4R)-2,3,4,5-tetrahydroxypentyl]benzo[g]pteridine-2,4-dione. Thank goodness we just refer to it as riboflavin! 😆
But with literally millions of naturally occurring and synthetic chemicals in existence, chemists do need a clear and unambiguous system for naming the huge number of molecules out there, and that is the job, among many other things, of the IUPAC.
But let’s get back to riboflavin…
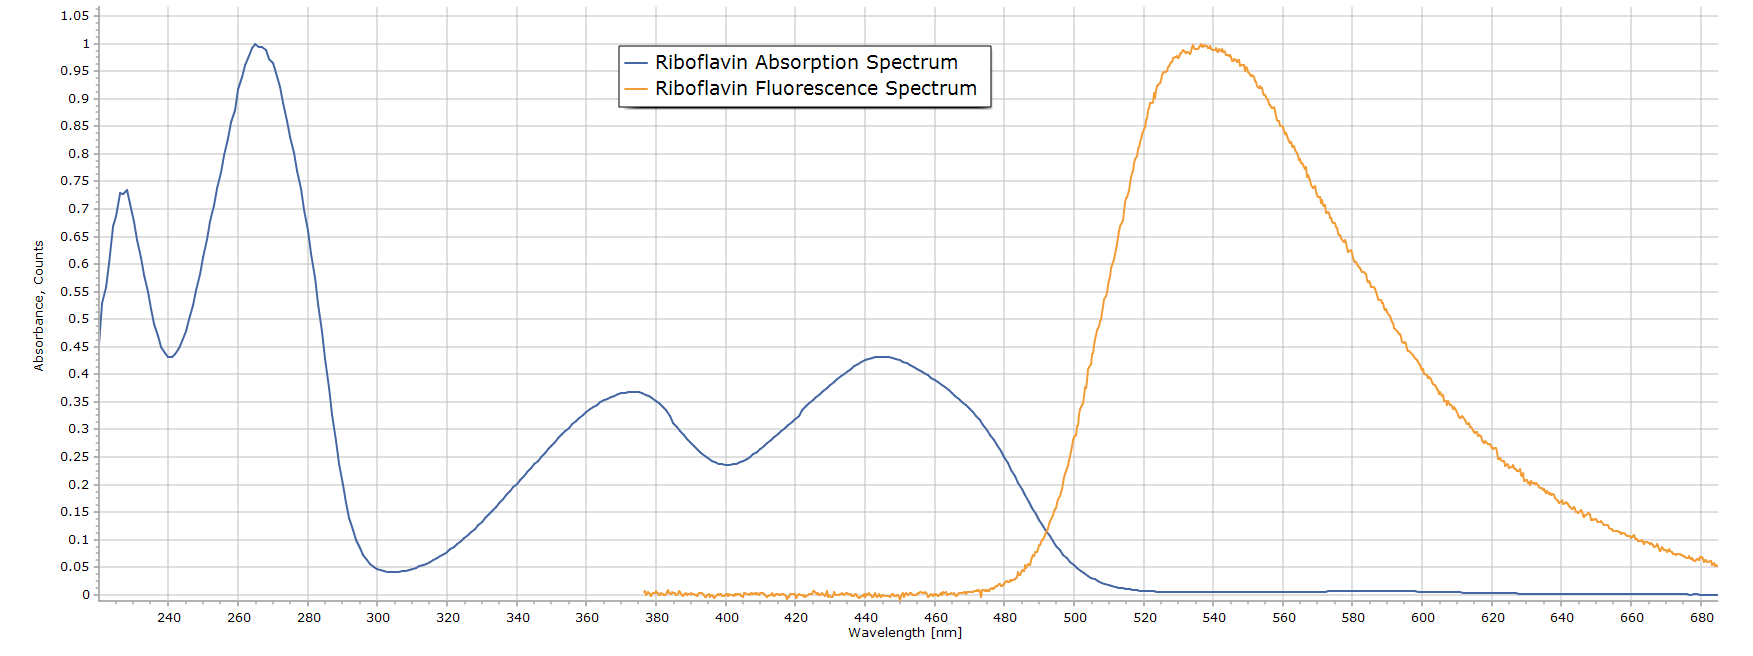
Since the molecule is highly conjugated, possessing alternating single and double bonds, riboflavin is highly coloured. It is a bright orange crystalline solid when in pure form. The absorption and emission (fluorescence) spectra of riboflavin in dilute acid solution can be seen here:
Fig. 1 Absorption and Fluorescence Spectra of Riboflavin
The absorption spectrum (blue) was obtained with a professional spectrometer (Perkin Elmer Lambda 25), although much simpler equipment can be used. The fluorescence spectrum (in orange) was obtained with the experimental setup described below. Both of the above spectra have been normalized (plotted on a scale of zero to 1 on the vertical axis) for ease of comparison.
The two smaller absorption bands with maxima at 375 nm and 445 nm are both suitable for exciting fluorescence in riboflavin. We will be using a UV LED light source emitting at 370 nm that overlaps nicely with the first of these bands in the near UV and that will excite molecules of riboflavin to the first excited electronic state. Once excited to this higher energy state, riboflavin molecules then fluoresce (orange curve) with a broad emission band and a maximum around 540 nm This will be a typical spectrum we should expect to see.
Methodology and Approach
Fluorescence and fluorescence spectroscopy have already been adequately described in earlier blog articles, so I will not elaborate further here. In order to measure riboflavin fluorescence we will need a pure sample of the vitamin that we can use as a reference standard, as well as a typical dietary supplement sample, from any suitable source, that contains the vitamin.
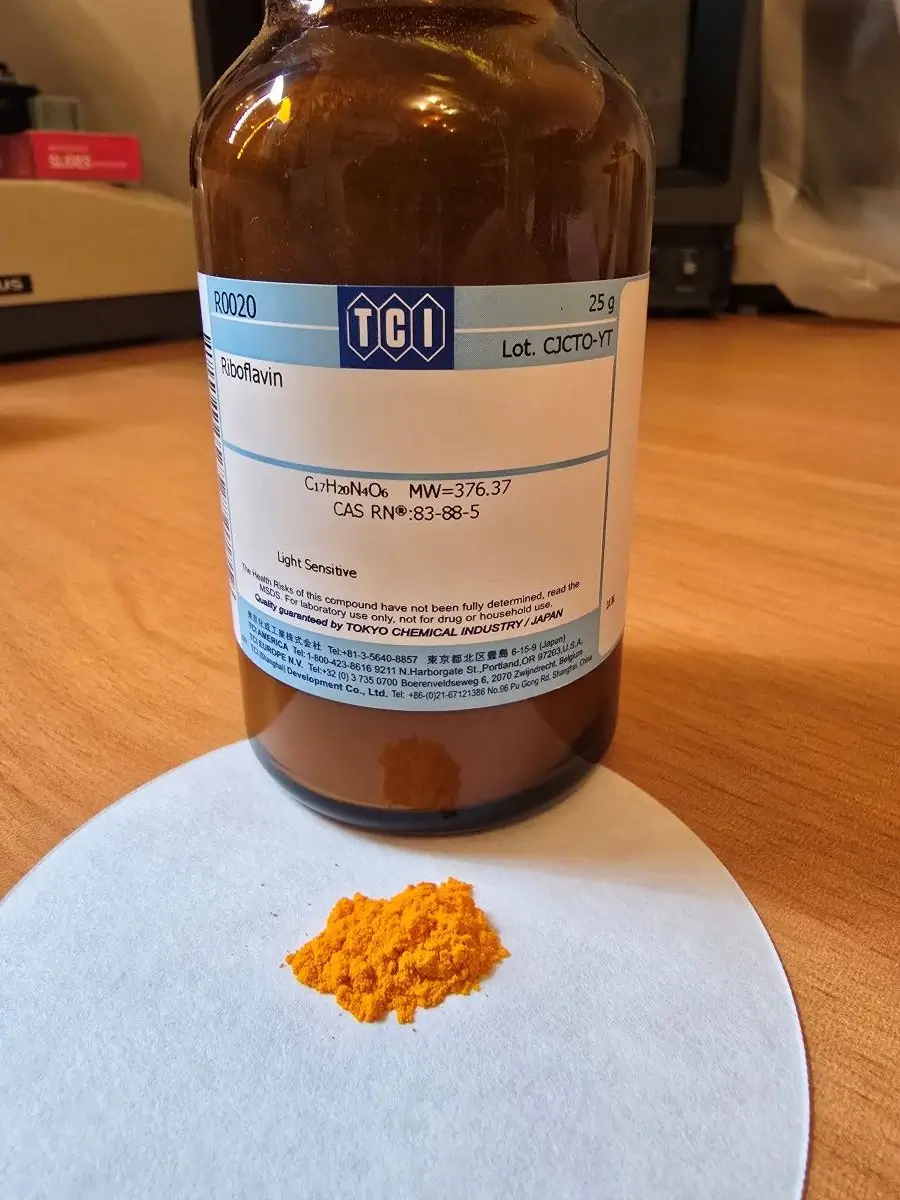
Sample of Pure Riboflavin
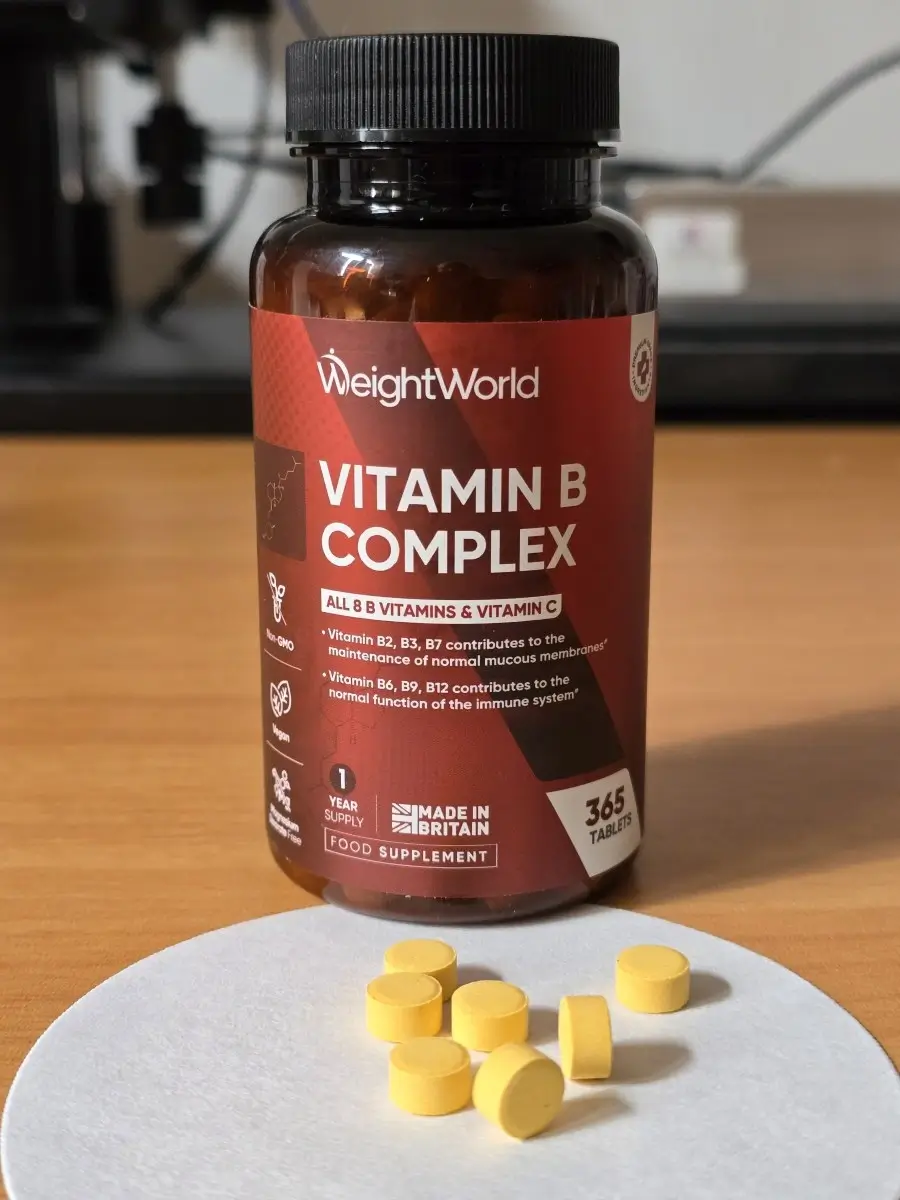
Multivitamin B Tablets
The core principle for this demonstration is to assume that the Beer-Lambert law applies and that the intensity of riboflavin fluorescence is directly proportional to concentration. Expressed as a very simple equation, the fluorescence intensity (F) is directly proportional to concentration (C) as
F = k C,
where k is a proportionality constant. So we can construct a calibration curve of fluorescence intensity versus concentration using standards of known riboflavin concentration. We obtain a straight line plot and then determine the riboflavin content for the unknown sample (our supplement tablet) from this plot. But we have to be careful for the following reasons…
Strictly speaking, the B-L law is only applicable to absorption processes, not emission processes such as fluorescence. Fortunately, in the same way that absorbance is directly proportional to the concentration of a chromophore (a light absorbing species), fluorescence intensity is directly proportional to the concentration of a fluorophore (a fluorescing species), but only up to a point. So we are justified in using this particular empirical law in this case.
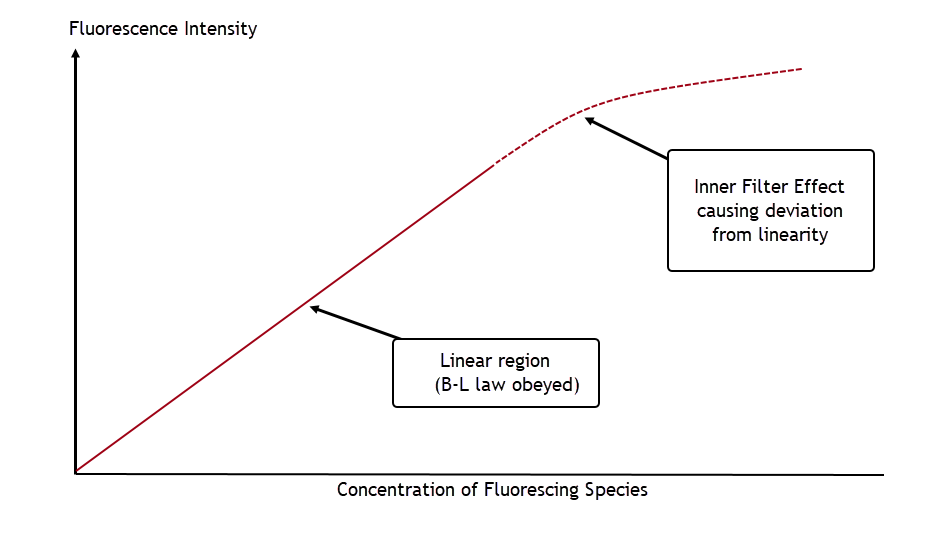
The key phrase here is up to a point. Because a fluorophore is also a chromophore, it can also absorb light. So at a high enough riboflavin concentration, photons emitted by fluorescing molecules can be re-absorbed by adjacent molecules before ever leaving the sample and then measured. The overall effect is to reduce the observed fluorescence intensity at high concentrations. This is called the inner filter effect.
Because of this effect, a plot of fluorescence intensity versus fluorophore concentration will eventually deviate from linearity at a high enough concentration, shown in this simple schematic:
In practice, the linearity of a Beer-Lambert plot can be extended to a higher concentration range by shortening the path length through the sample. (Recall that the degree of light absorption is equal to ε c l, where l is the path length. Refer to this link for more information.)
In this demonstration we are working with standard 1 cm path length spectrometer cuvettes, so we have to keep to low riboflavin concentrations such that the peak absorbance of the solutions does not become too high. Typically 0.3-0.4 absorbance units is acceptable.
Practical Setup
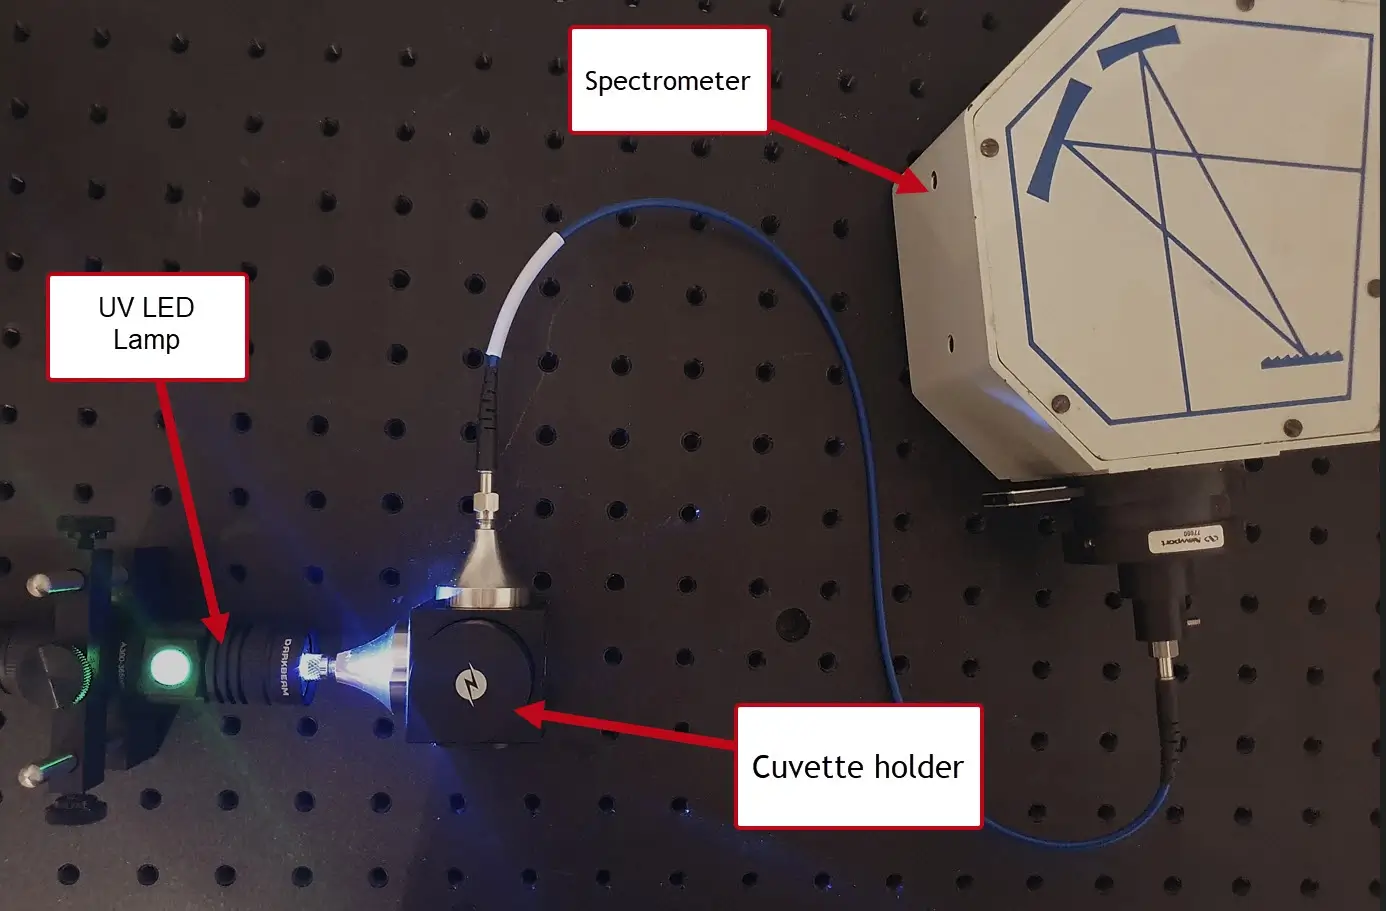
The experimental setup for fluorescence is very similar to that used in previous posts, with a small UV lamp as the excitation source and any fluorescence observed at right angles. Fluorescent light from the sample is then directed via an optical fibre to a small spectrometer.
Fig. 2 The Experimental Setup
Solution and Sample Preparation
Working Standards
We first prepare a stock solution of pure riboflavin by accurately weighing ~10.0 mg with an analytical balance. Riboflavin is only sparingly soluble in water but slightly more soluble in acidic media. Acetic acid or dilute hydrochloric acid are good solvents to use here, and I have used 0.1 M HCl for all sample preps. The prepared stock solution is 10 mg riboflavin in 100 mL 0.1M acid, and the final concentration is 100 μg/mL (or 100 mg/L = 100 ppm).
12 working standard solutions are then prepared according to the following table:
Working Standard
Stock Volume (mL)
Final Conc in μg/mL (mg/L or ppm)
S1
0.25
0.5
S2
0.5
1.0
S3
1.0
2.0
S4
2.0
4.0
S5
3.0
6.0
S6
4.0
8.0
S7
5.0
10.0
S8
6.0
12.0
S9
7.0
14.0
S10
8.0
16.0
S11
9.0
18.0
S12
10.0
20.0
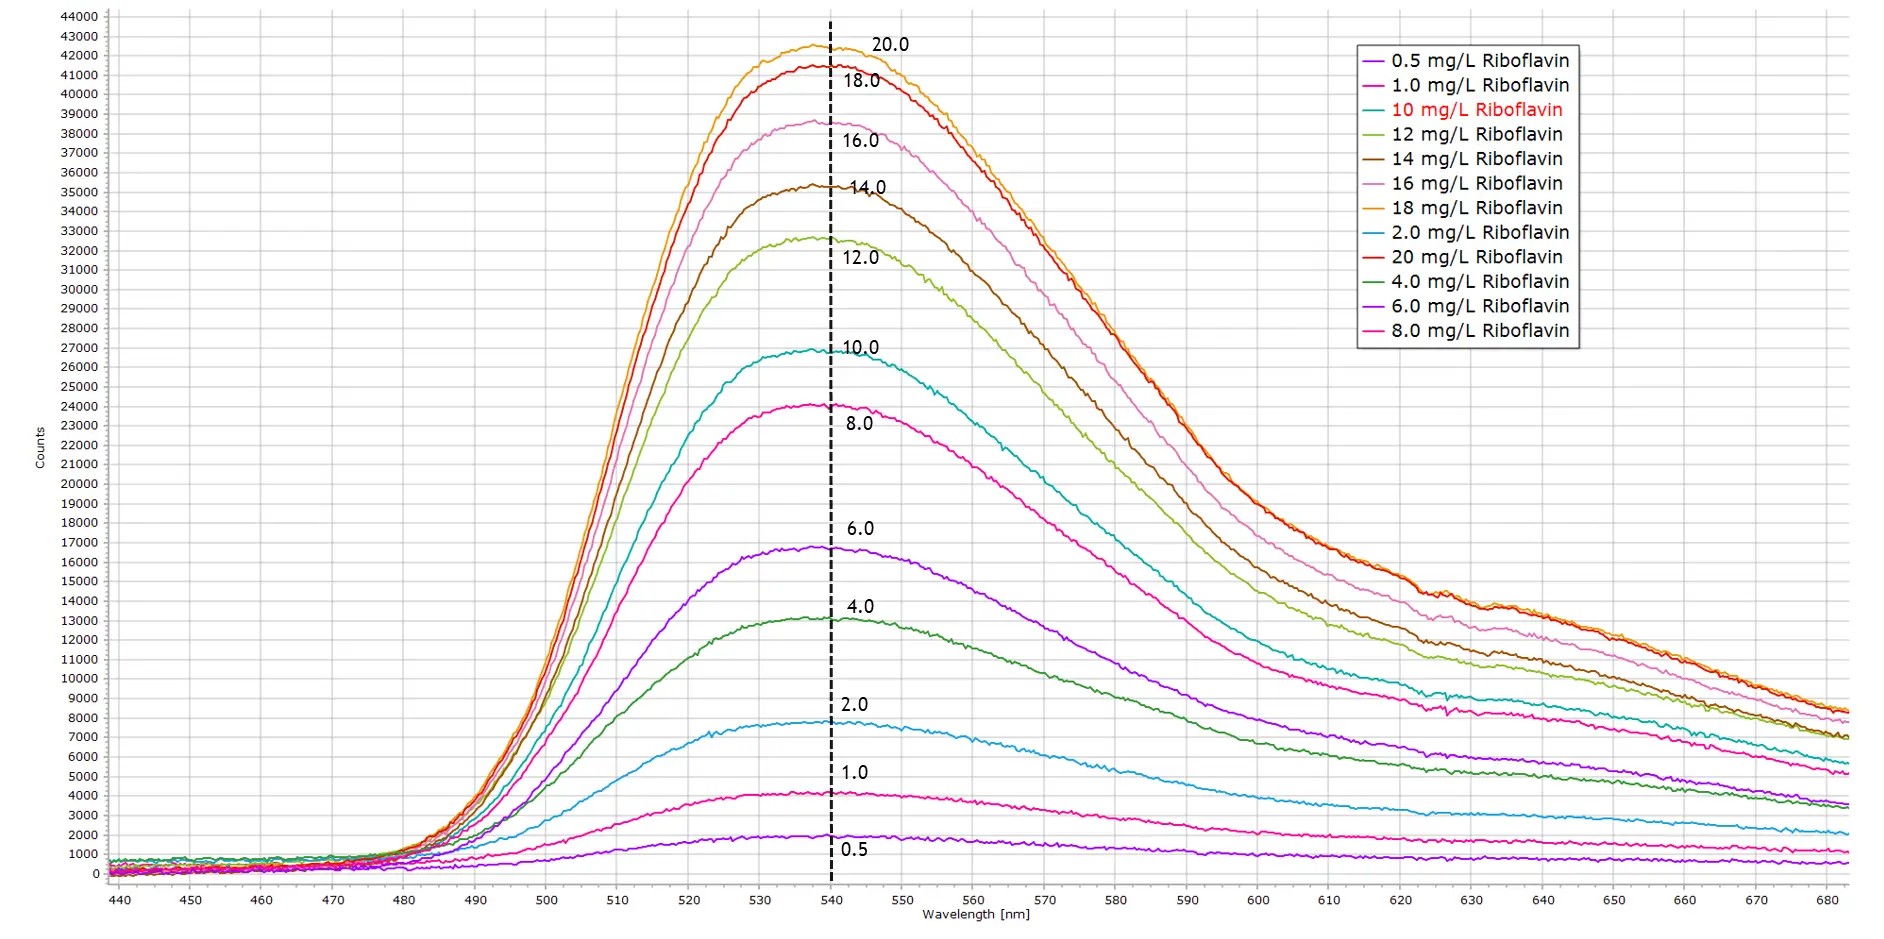
Fluorescence spectra of all 12 standards S1-S12 are presented in the following image:
Fig. 3 Fluorescence Spectra of the Working Standard Solutions
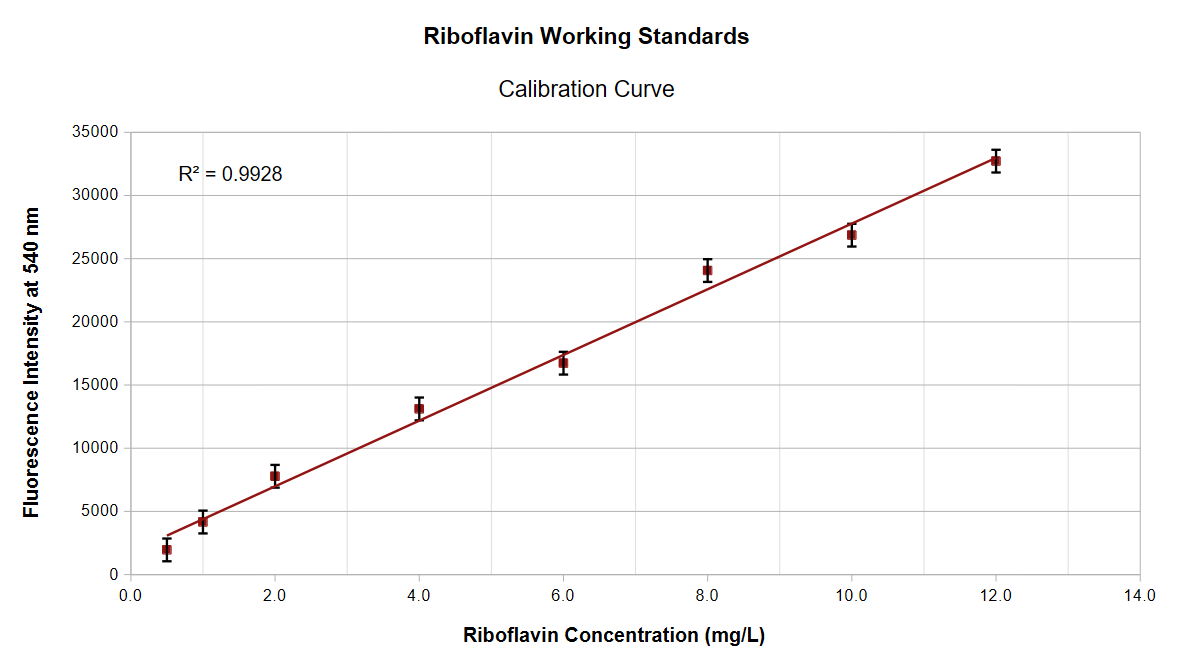
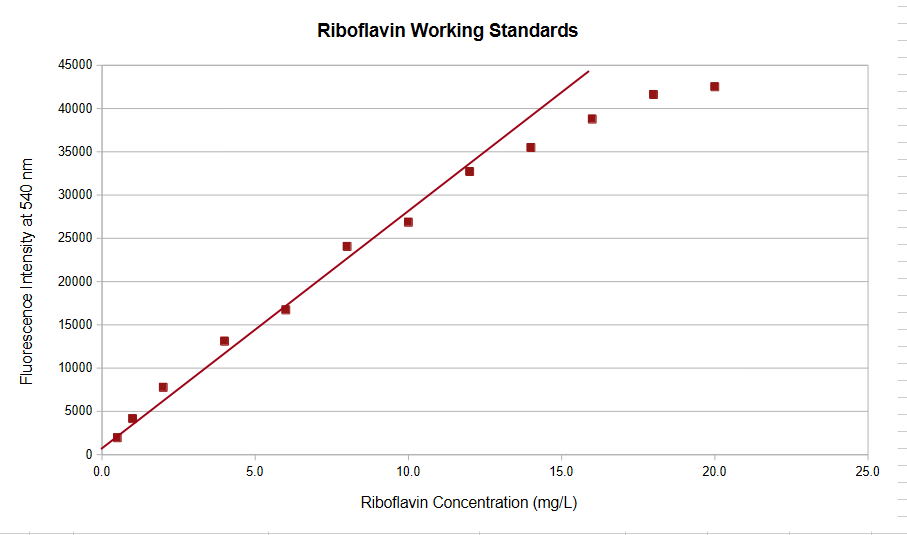
And from peak intensity values at 540 nm we can construct the following straight line calibration curve, with a correlation coefficient R2 very close to one (0.993).
Fig. 4 Resulting Beer-Lambert Calibration Curve of Working Standards
At concentrations higher than about 12 mg/L we begin to see deviations from the Beer-Lamber law for the reasons explained above concerning the inner filter effect, and the linear plot begins to curve away as shown here:
Fig. 5 Deviation from Linearity at High Riboflavin Concentrations
The Test Sample
Practical Considerations
Some vitamin supplement tablets can be difficult to dissolve and can prove challenging. This is due to the way they are formulated and manufactured. Supplement tablets, and pharmaceutical grade tablets in general, contain additional materials (excipients) necessary to form a physically solid and stable tablet shape. In addition to the active ingredient, a tablet will contain a binder such as cellulose or starch, fillers such as lactose or calcium salts, and there will always be a lubricant material such as magnesium stearate.
The lubricant is there because all tablets are made in a high speed rotary press on an industrial scale. These presses typically produce 20,000 – 100,000 tablets per hour even for a medium-speed machine. All these tablets need to be rapidly ejected from the press tooling before being filled again with raw materials. The lubricant serves to allow clean ejection of every tablet from the press.
If you want to try this experiment yourself and you end up with a cloudy test solution, filtering will remove any insoluble excipients and sonicating the solution for 10 – 15 minutes should produce a final clear solution. A perfectly clear test solution is required for reproducible fluorescence spectra.
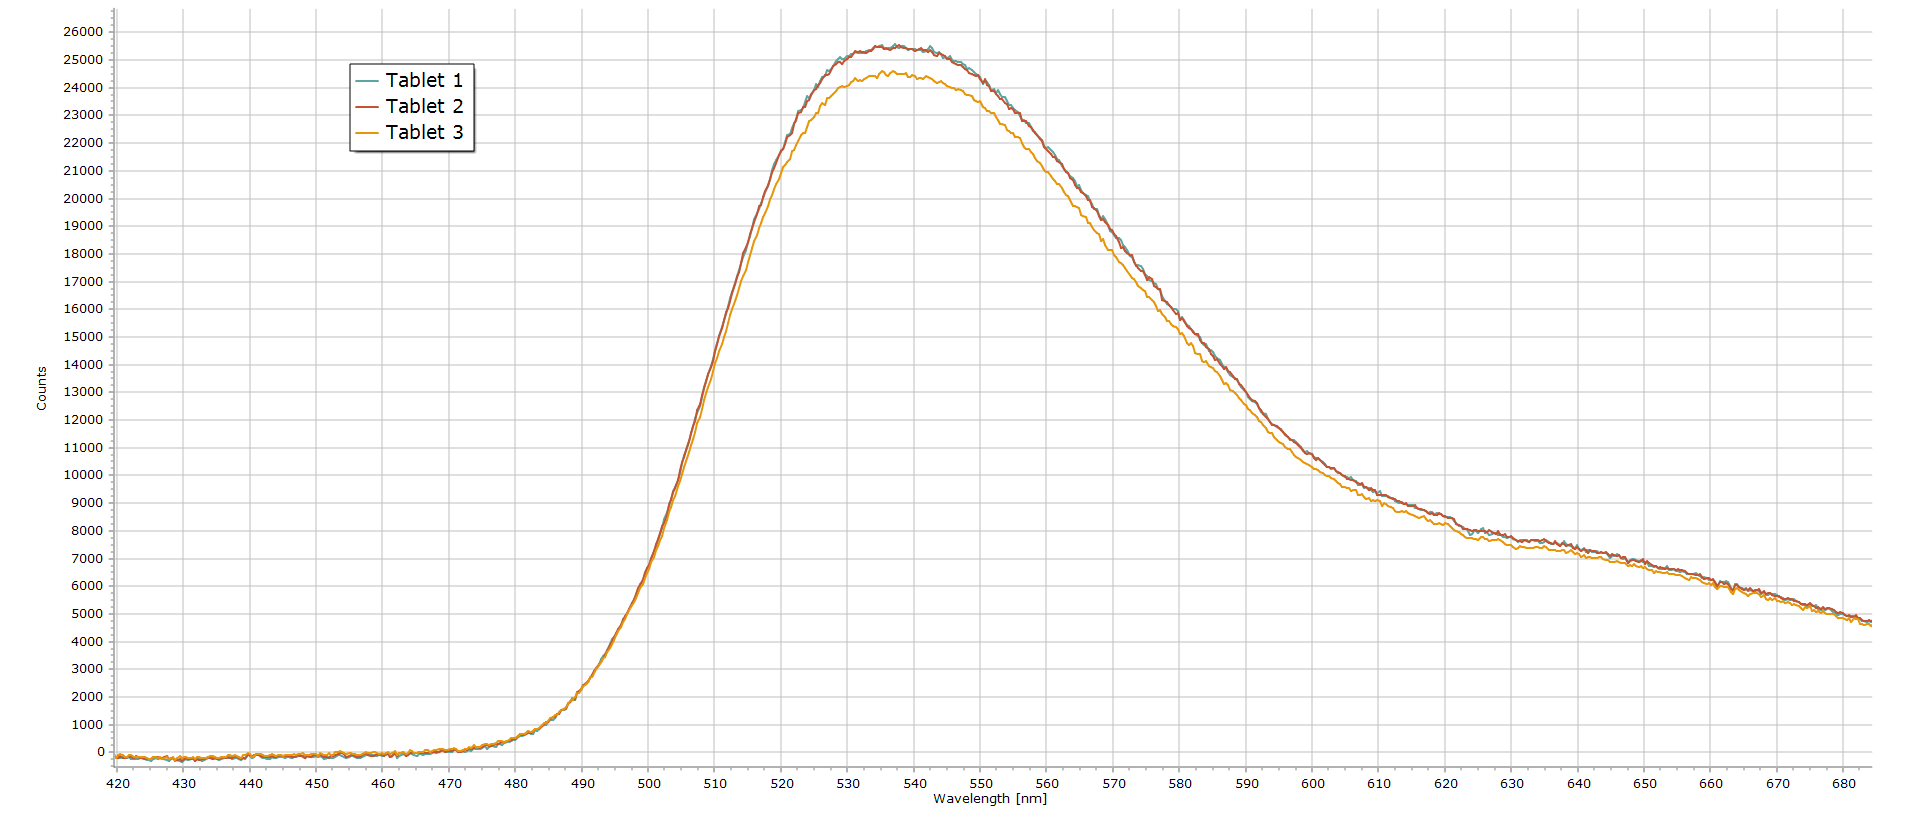
We will be measuring the quantity of riboflavin in a multi-vitamin tablet that is claimed to contain at least 7mg riboflavin as well as several other B vitamins plus vitamin C in each tablet.
Fluorescence spectra from 3 individual tablets are reproduced here.
Fig. 6 Fluorescence Spectra for Three Test Tablets
From these three spectrum curves the average fluorescence intensity at 540 nm is ∼ 25,150 counts. And from the calibration curve shown earlier, this translates to a riboflavin content equal to about 9 mg. This value is well above the stated vitamin content (7 mg) on the bottle label and so the claimed label content of at least 7 mg is correct and acceptable.
Conclusions
Several essential vitamins fluoresce under UV light. Of the B vitamins, B1 (Thiamine) and B3 (Niacin) both fluoresce weakly in the blue. But by far the strongest is Riboflavin with its strong yellow-green emission and as such can be used as a tracer in analytical assays and experiments.
What is Fluorescence? Before we can consider what fluorescence actually is in scientific terms, we must mention the general process of luminescence. Luminescence is defined…
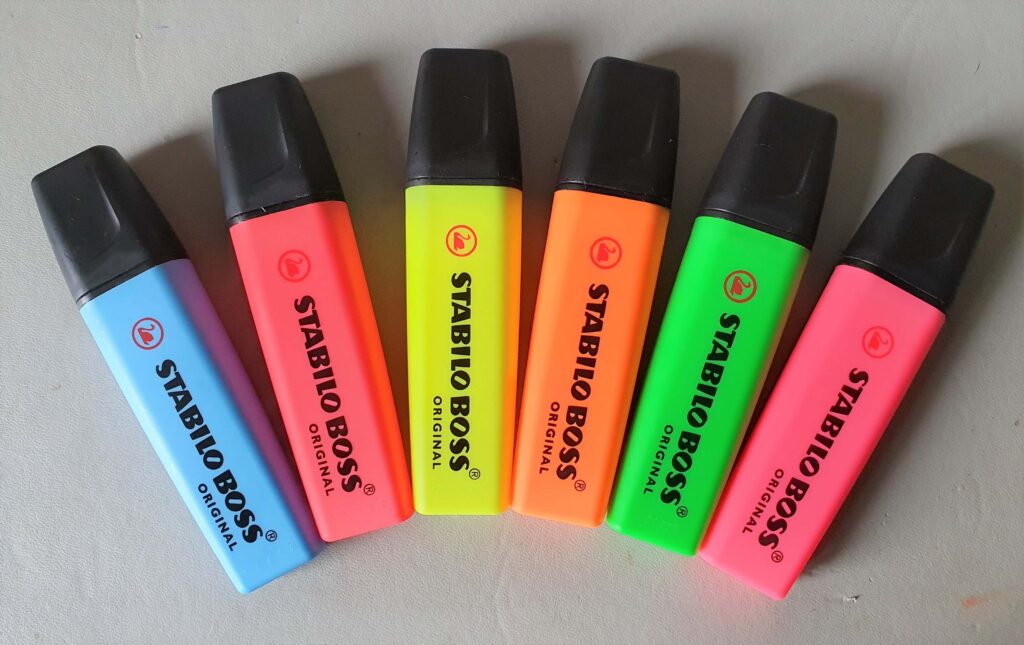
Measuring the fluorescence from highlighter pens is always an interesting educational experiment to try and is very popular in schools and colleges to demonstrate the…
It’s interesting to think about how much marketing goes into these supplements. I’ve found it’s often hard to really know if you’re getting the full benefit.
Agree. Tere’s a great deal of money spent on marketing not just vitamins but all health supplements. Country national health authorities do have regulations, but they are certainly not as highly regulated as the pharmaceutical industry, which is tightly controlled and audited by agencies such as the FDA and EMEA.