I’ll say it again… Raman rules! No apologies because I’m a big fan of his and all work originally worked on this fascinating phenomenon.
I am referring here to the Indian physicist Chandrasekhara Venkata Raman who made a remarkable discovery in 1928 concerning the behaviour of light scattered from molecules. C. V. Raman was awarded the Nobel Prize for Physics in 1930 for his meticulous efforts in this field of study (although significant credit must also be given to his collaborator K. S. Krishnan who actually performed many of Raman’s first suggested experiments).
Incredibly, this same phenomenon was also predicted and observed, with independent results published literally 7 days(!) before Raman’s own results, by the Russian physicists Landsberg and Mandel’shtam (see reference 3). A shame at the time that the Nobel Prize Committee, which was created 23 years before this discovery, did not attribute recognition to those Russian scientists. Be that as it may, this important discovery was named after C. V. Raman in the West and it is widely known as the Raman Effect.
Background
So what is the Raman Effect and why is it important for us today? In essence, the Raman Effect is an extremely weak scattering of light from any “Raman Active” material, when a photon of light collides with a molecule. It is a fascinating phenomenon and with today’s high-efficiency light detectors and lasers, it is a relatively straightforward effect to detect and measure with the right equipment.
But back in Raman’s day, well before lasers, sensitive detectors and specialized filters had been invented, this must have been an incredibly difficult thing to observe in the laboratory. Perhaps one reason why Raman was awarded a well-deserved Nobel prize.
The Raman effect is typically observed in the infrared region of the electromagnetic spectrum. It takes place for Raman active materials after a collision between a light photon and a target molecule, but we may not always detect it without the right conditions and equipment. I will return to the importance of Raman techniques and applications towards the end of this post. For now, we have to consider what exactly this phenomenon is in more scientific terms, but without all the mathematics and quantum mechanics.
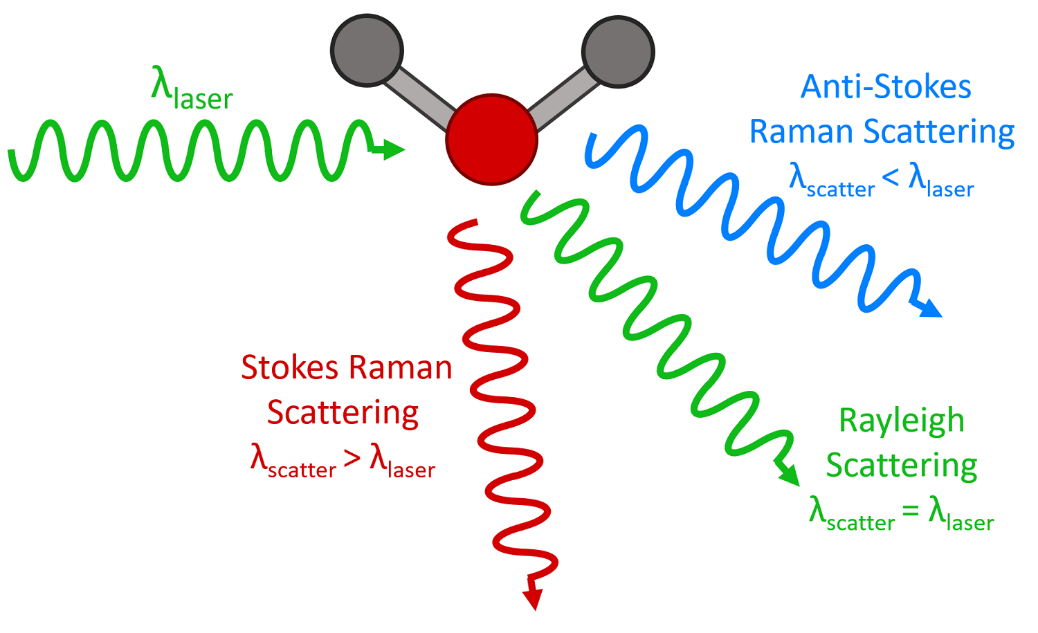
When a light photon collides with a Raman-active molecule it is scattered by the collision. But that collision hides some subtle details and one of three things can happen:
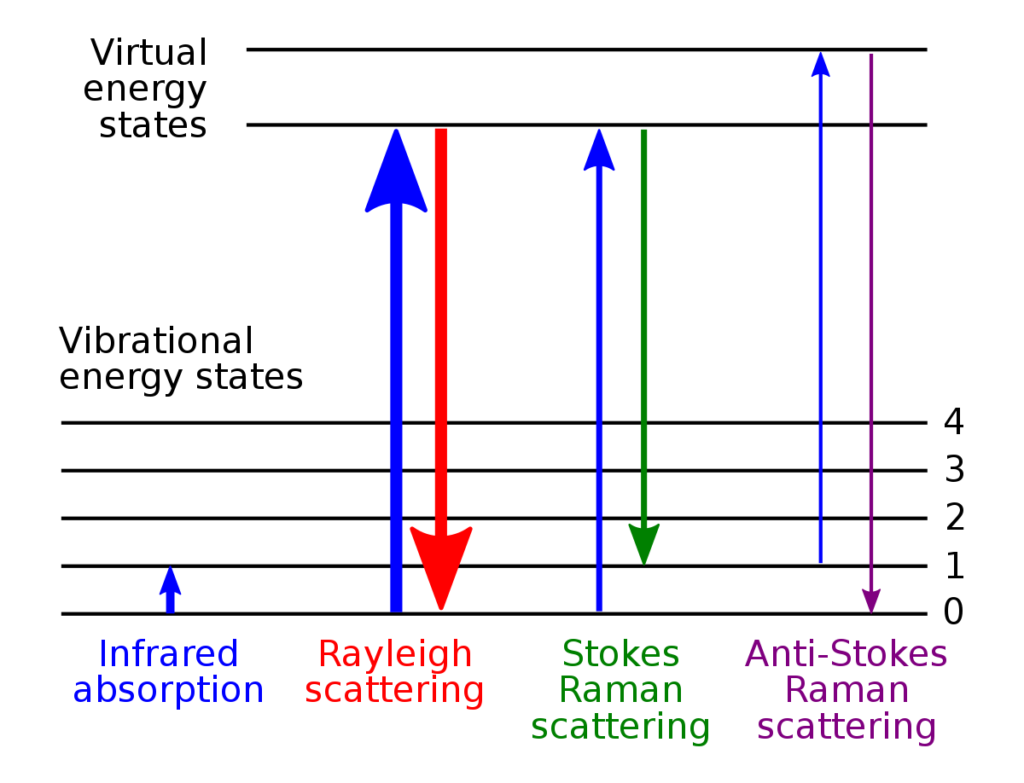
The photon can simply be scattered elastically by the molecule with no change in energy or wavelength. This is referred to as Rayleigh Scattering (after the 19th century British physicist Lord Rayleigh). This is the most probable outcome from the collision and explains why the daytime sky is blue. All that happens is that the photon bounces off the molecule and changes direction without gaining or losing energy in the process.
Alternatively, the photon can be scattered inelastically. It loses some of its energy during the collision, transferring some to the molecule which increases the vibrational energy in one or more of the molecule’s bonds. This is known as Stokes Raman Scattering (or just Stokes Scattering).
Another outcome is that the photon is scattered inelastically again, but this time it gains some energy from the molecule during the collision because a bond in the molecule just happened to be in an excited vibrational state at the moment of the encounter and transferred this excess vibrational energy to the photon. The molecule therefore loses some energy in transferring it to the photon and the photon gains some energy. This is known as Anti-Stokes Raman Scattering (or simply Anti-Stokes Scattering).
In all 3 cases, the Law of the Conservation of Energy of the total system (photon + molecule) before and after collision is unchanged. This is a universal physical law which has proven itself throughout history. (So apologies to all Star Trek and Star Wars fans out there, whose TV shows always seem to defy some law or principle of physics… I remain a big fan though 😉)
Now let’s look at the Raman Effect in a little more technical detail and in order to do this we have to consider the energy levels of a molecule.
It is well understood from physical principles that the dominant process in this interaction between the photon and the molecule is elastic scattering. This is the Rayleigh scattering signal (Case 1) mentioned earlier.
The Stokes Raman signal (Case 2 above) is at least one million times weaker than the Rayleigh signal which explains why Raman had a hard time finding it.
And with Case 3 (anti-Stokes Raman scattering) the effect is weaker still for the following reason: In order for Anti-Stokes scattering to take place, the target molecule already needs to be in a vibrationally excited state before it can transfer some of its excess energy to the photon. The statistical probability of this occuring is much lower, because when systems are in thermodynamic equilibrium, (a Boltzmann distribution of states), the lower energy state is always more populated than any upper excited energy state, irrespective of temperature.
Therefore the rate of transitions between the more populated states (Stokes scattered transitions) will always be greater than the rate of transitions from the less populated states (anti-Stokes scattered transitions).
These three types of transitions are depicted schematically in Figure 2, where the thickness of the arrows representing the Raman transitions indicate the probability of the type of scattering; (not to scale of course since the probability of Rayleigh scattering far outweighs the probabilities of Stokes scattering processes).
You have heard me mention on several occasions a Raman-active molecule. Here’s a brief explanation: In order for a molecule to exhibit the Raman effect, there has to be a change in the polarisability of the molecule and the Raman signal is directly proportional to this change in polarisability. Polarisability refers to the ability of a molecule’s electron cloud to be distorted by an external electric field. This external field comes from the incident photon. When the photon strikes a molecule, the electric field associated with the photon induces an oscillation in the molecule’s electron cloud. When the molecule undergoes a vibrational transition, the distribution of electron density within the molecule changes, resulting in a change in polarisability. The vibration causing a change in the polarisability makes this specific vibrational mode Raman-active.
A Raman spectrum therefore is simply a plot of Raman scattered light intensity as a function of the shift in energy (or frequency) from the purely elastically scattered light of the central Rayleigh line. The actual frequency positions of these Raman lines in the spectrum depend on the energy differences between the vibrational states of the molecular bonds as they relax to lower energies. These energy differences are sensitively dependent on the nature and environment of the various chemical bonds in molecules, which is why Raman spectroscopy can yield useful structural information.
Because the light photons are not actually absorbed by the molecule (unlike infrared IR spectroscopy which sends the bond in a molecule to a higher vibrational energy state), there is no actual transition between the molecule’s energy levels with the Raman Effect. The Raman Effect is a scattering phenomenon and distinct from true absorption and/or emission processes that we observe with IR spectroscopy, or with visible light fluorescence. These processes have been explained in other posts here and here.
It turns out that molecules that do not exhibit an IR absorption spectrum can often exhibit a Raman spectrum due to this change in polarizability and distortion of a molecule’s electron cloud in a specific bond. As already mentioned, they are described as being Raman-active.
Raman techniques can complement the structural information obtained from IR absorption methods. The two techniques are often used in tandem to obtain the maximum possible structural information on molecules.
More information is readily available online that explains the Raman Effect in much more quantitative, mathematical detail.
The Raman Spectrum - a little more detail
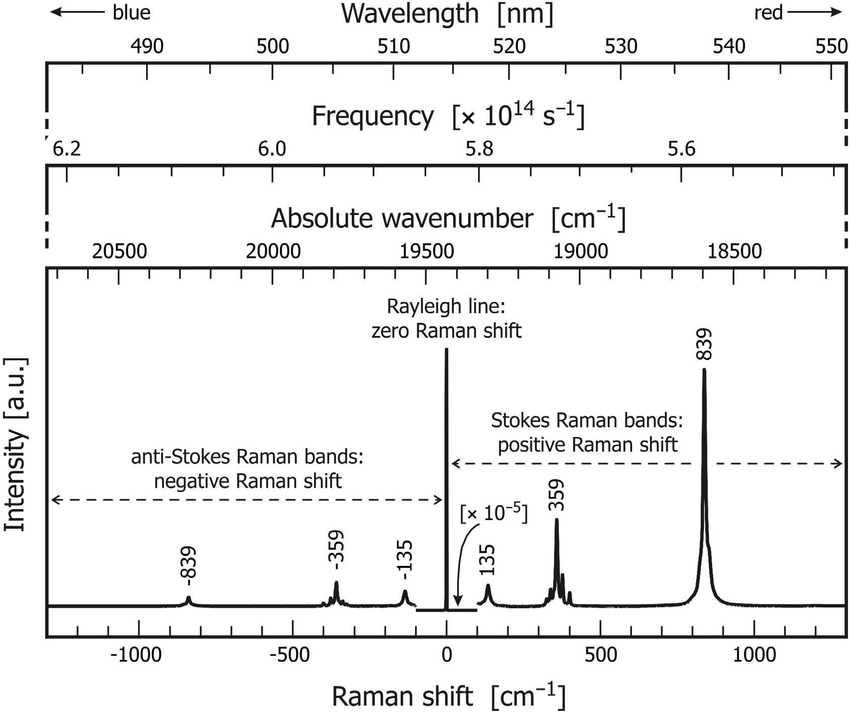
Since we are dealing with a light scattering effect and not absorption or emission, a Raman spectrum is a plot of the intensity of Raman scattered light as a function of the energy (frequency) difference, Δν, from the elastically scattered Rayleigh photons, as mentioned above. This frequency difference is called the Raman Shift and is usually measured in wavenumbers (cm-1.). Thus a Raman spectrum for a molecule will show spectral lines or bands, corresponding to changes in vibrational states, situated symmetrically around the principal Rayleigh (Δν = 0) scattered line. These lines represent the Stokes and Anti-Stokes Raman transitions.
Due to the differences in populations between the ground and higher energy states as mentioned earlier on Boltzmann population differences, the relative intensities of these two groups of Stokes and Anti-Stokes peaks will usually be different, with Stokes scattered peaks typically being much stronger than Anti-Stokes scattered peaks.
A typical Raman spectrum is shown diagrammatically here:
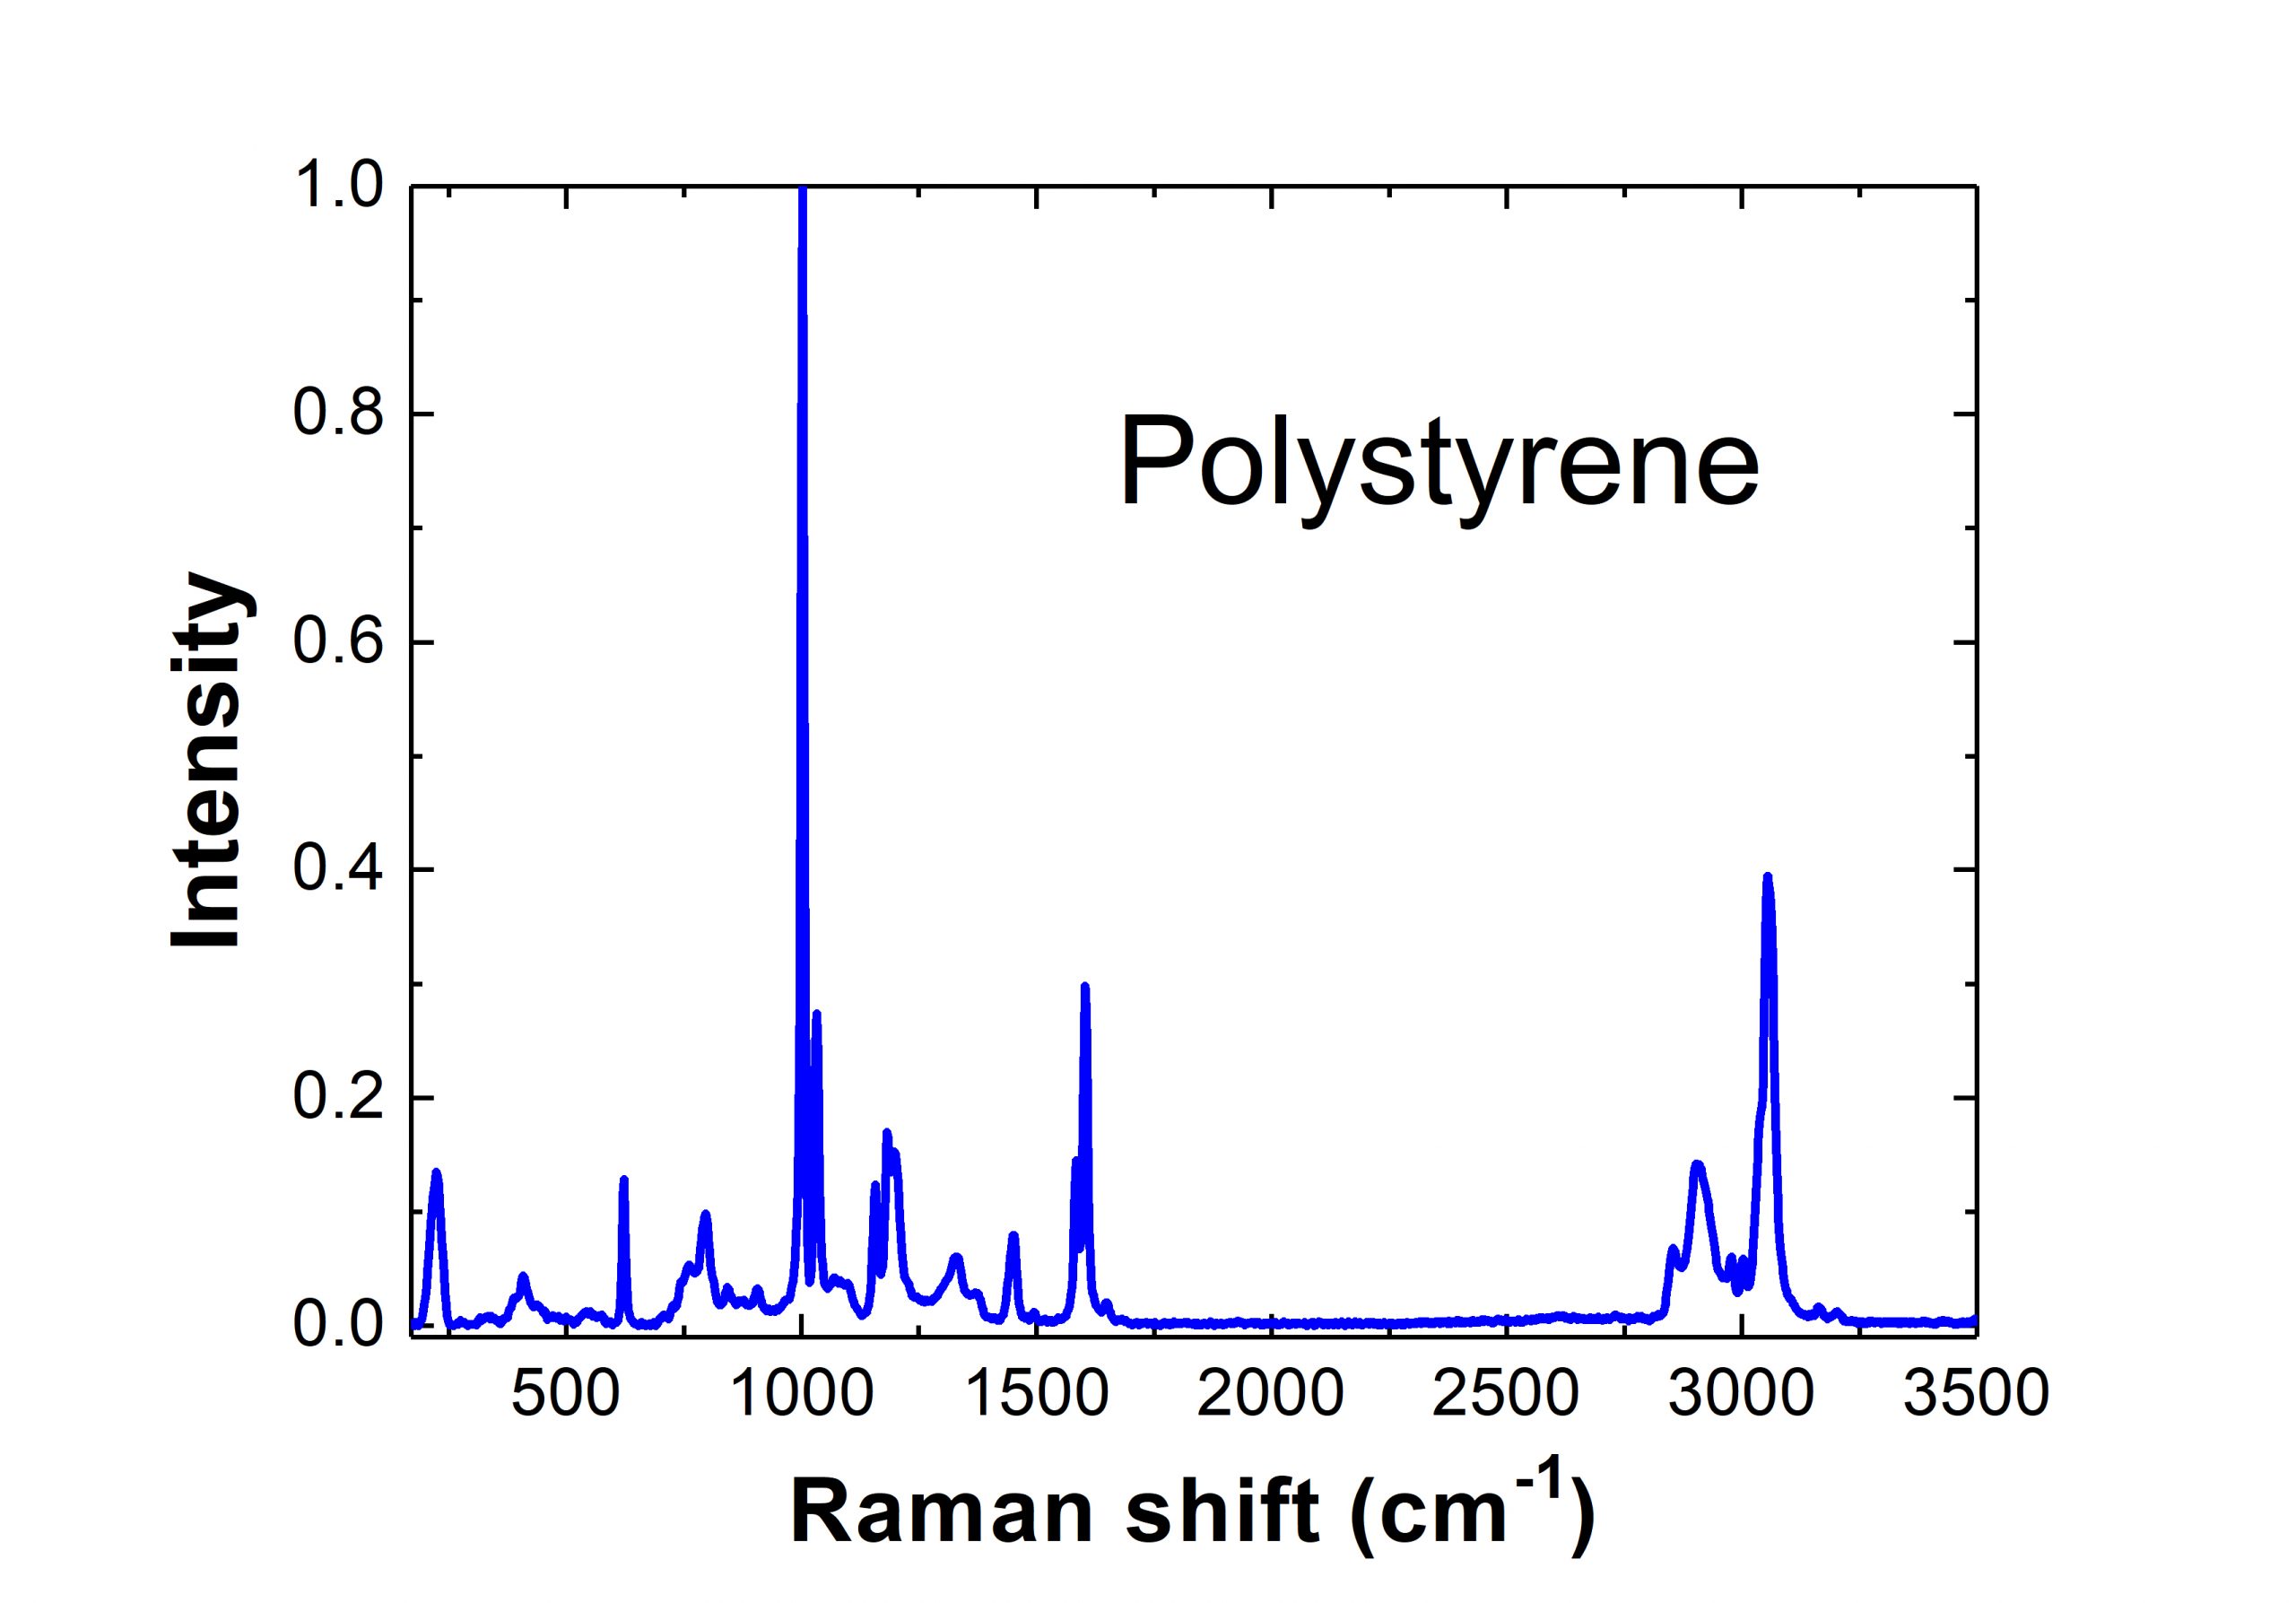
And an actual Raman spectrum for the polymer polystyrene can be seen here:
Recent Developments
In the last 40-50 years or so the detection and measurement of Raman spectra have steadily progressed with technological developments and improvements. Raman investigations used to be somewhat difficult experiments to design and implement, even in university research labs with sizeable budgets, powerful lasers and high resolution spectrometers and monochromators attempting to isolate the extremely weak Raman signals.
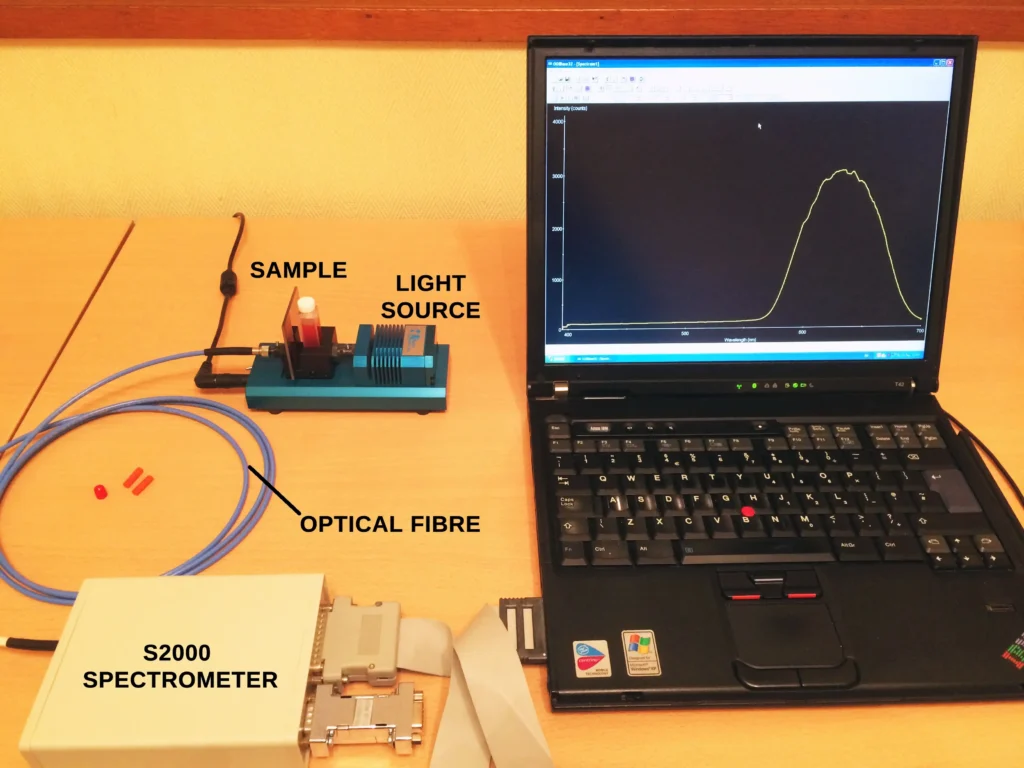
Even as recently as 10-20 years ago a dispersive Raman spectrometer would still have a significant footprint on the lab bench, and for high resolution applications it still does. But today we have small, powerful diode pumped solid state (DPSS) lasers that have useful Raman excitation wavelengths in the visible and near IR. These are used with highly efficient laser line rejection filters that allow the weak Raman lines to pass whilst blocking Rayleigh scattered light at the laser wavelength. Couple that with sensitive detectors inside hand-sized spectrometers and you have a highly effective and compact Raman system. A good example of such a system is given in this post.
These improvements allow us to obtain Raman spectra from a large range of materials. Add a microscope to the setup to examine small areas within a heterogeneous sample and we have an extremely practical, even portable, analytical technique to determine the chemical composition of different materials.
The recording of Raman spectra today from a large variety of different substances such as pharmaceutical drugs, geological samples and minerals, polymers of all kinds, archival documents, museum artwork, paintings, jewellery and archaeological specimens, as well as the more conventional laboratory samples of organic solvents and solutions, is now commonplace with Raman spectrometers and Raman probes.
This concludes this post on the Raman Effect and future posts will present some of results with a real-life Raman system.
Just remember… Raman Rules!
References
- Introductory Raman Spectroscopy, 2nd Ed., J. R. Ferraro, K. Nakamoto and C. W. Brown, Elsevier, 2003.
- Modern Raman spectroscopy: A Practical Approach, Ewen Smith and Geoffrey Dent, 2nd Ed., John Wiley & Sons, 2019.
- https://ufn.ru/en/articles/1998/12/g/references.html