
Introduction
Some time ago in this Lab Notebook (back in 2023) I demonstrated the concept of F-centres, using crystals of caesium chloride (CsCl) excited in an electrical discharge. At the end of that short demonstration, which highlighted the colour change that takes place during F-centre formation, I recorded the spectrum of a bluish-white glow. This glow appeared above the crystals when a high voltage was applied with a small Tesla coil. Here is that same video again, showing this “strange” luminescence:
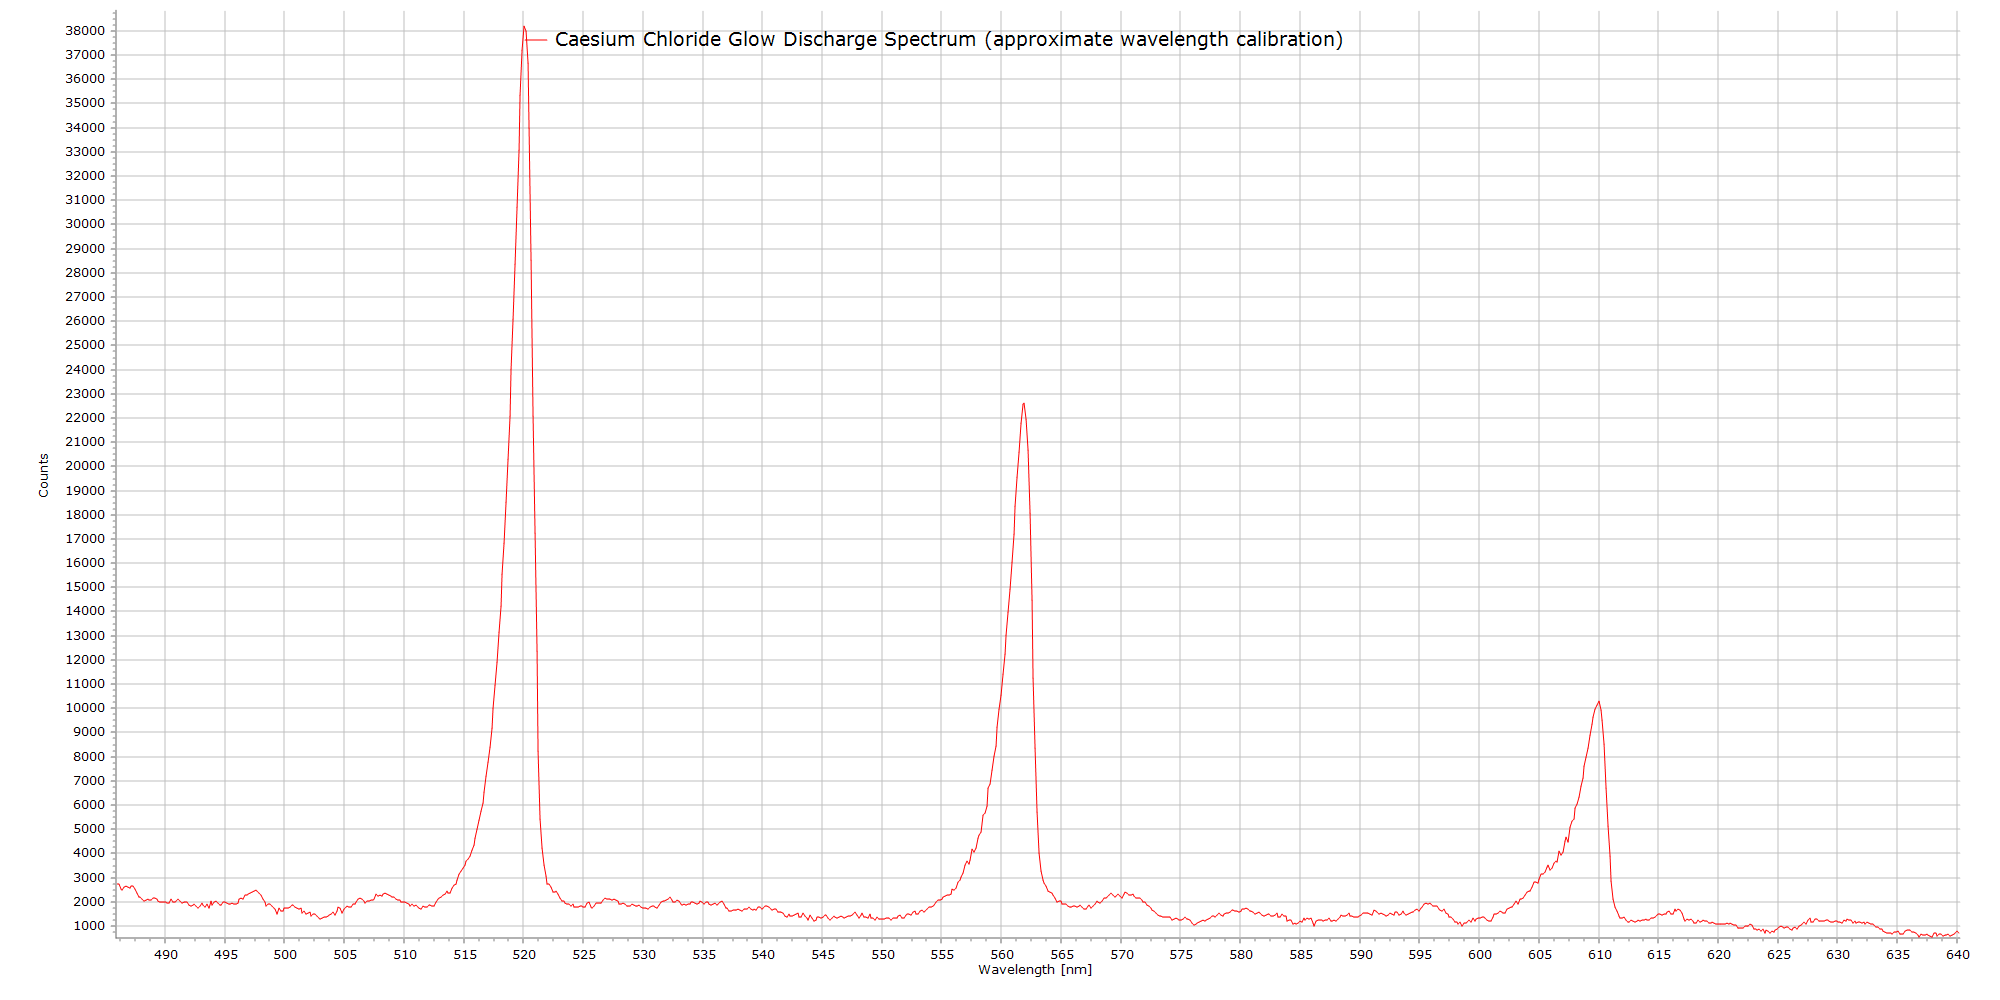
Because many articles published at Steve’s Open Lab involve spectroscopy (my favourite topic!) I then recorded a spectrum of this glow and displayed it at the end of the article. I’ve reproduced this spectrum it here for convenience:

At the time, I admitted that I was having trouble assigning chemical species to the various emission lines or bands seen in this spectrum and I asked for readers’ suggestions. More recently (November 2025), I provided an update to the article, with my own very tentative spectral line assignment, as well as briefly looking at some other compounds for F-centres.
Things then remained quiet for a few months. Until very recently, when several readers responded with some comments, that you can see at the end of that update in the Comments section.
From the responses, there appears to be two schools of thought regarding the chemical nature of the species (are they atoms? molecules? ions?) producing these emission lines or bands. One reader suggested that the lines originate from molecular chlorine (Cl2), and a second proposal is that the emission lines may be due to carbon monoxide (CO) contamination in the discharge tube.
So in this article I will examine these two possibilities in some detail.
Is this Carbon Monoxide Contamination?
The potential for contamination by CO may originate from traces of air and moisture remaining in the sample during manufacture. The glass vial holding the caesium chloride sample is shown again here. Dimensions of the vial are approximately 5 cm x 1 cm
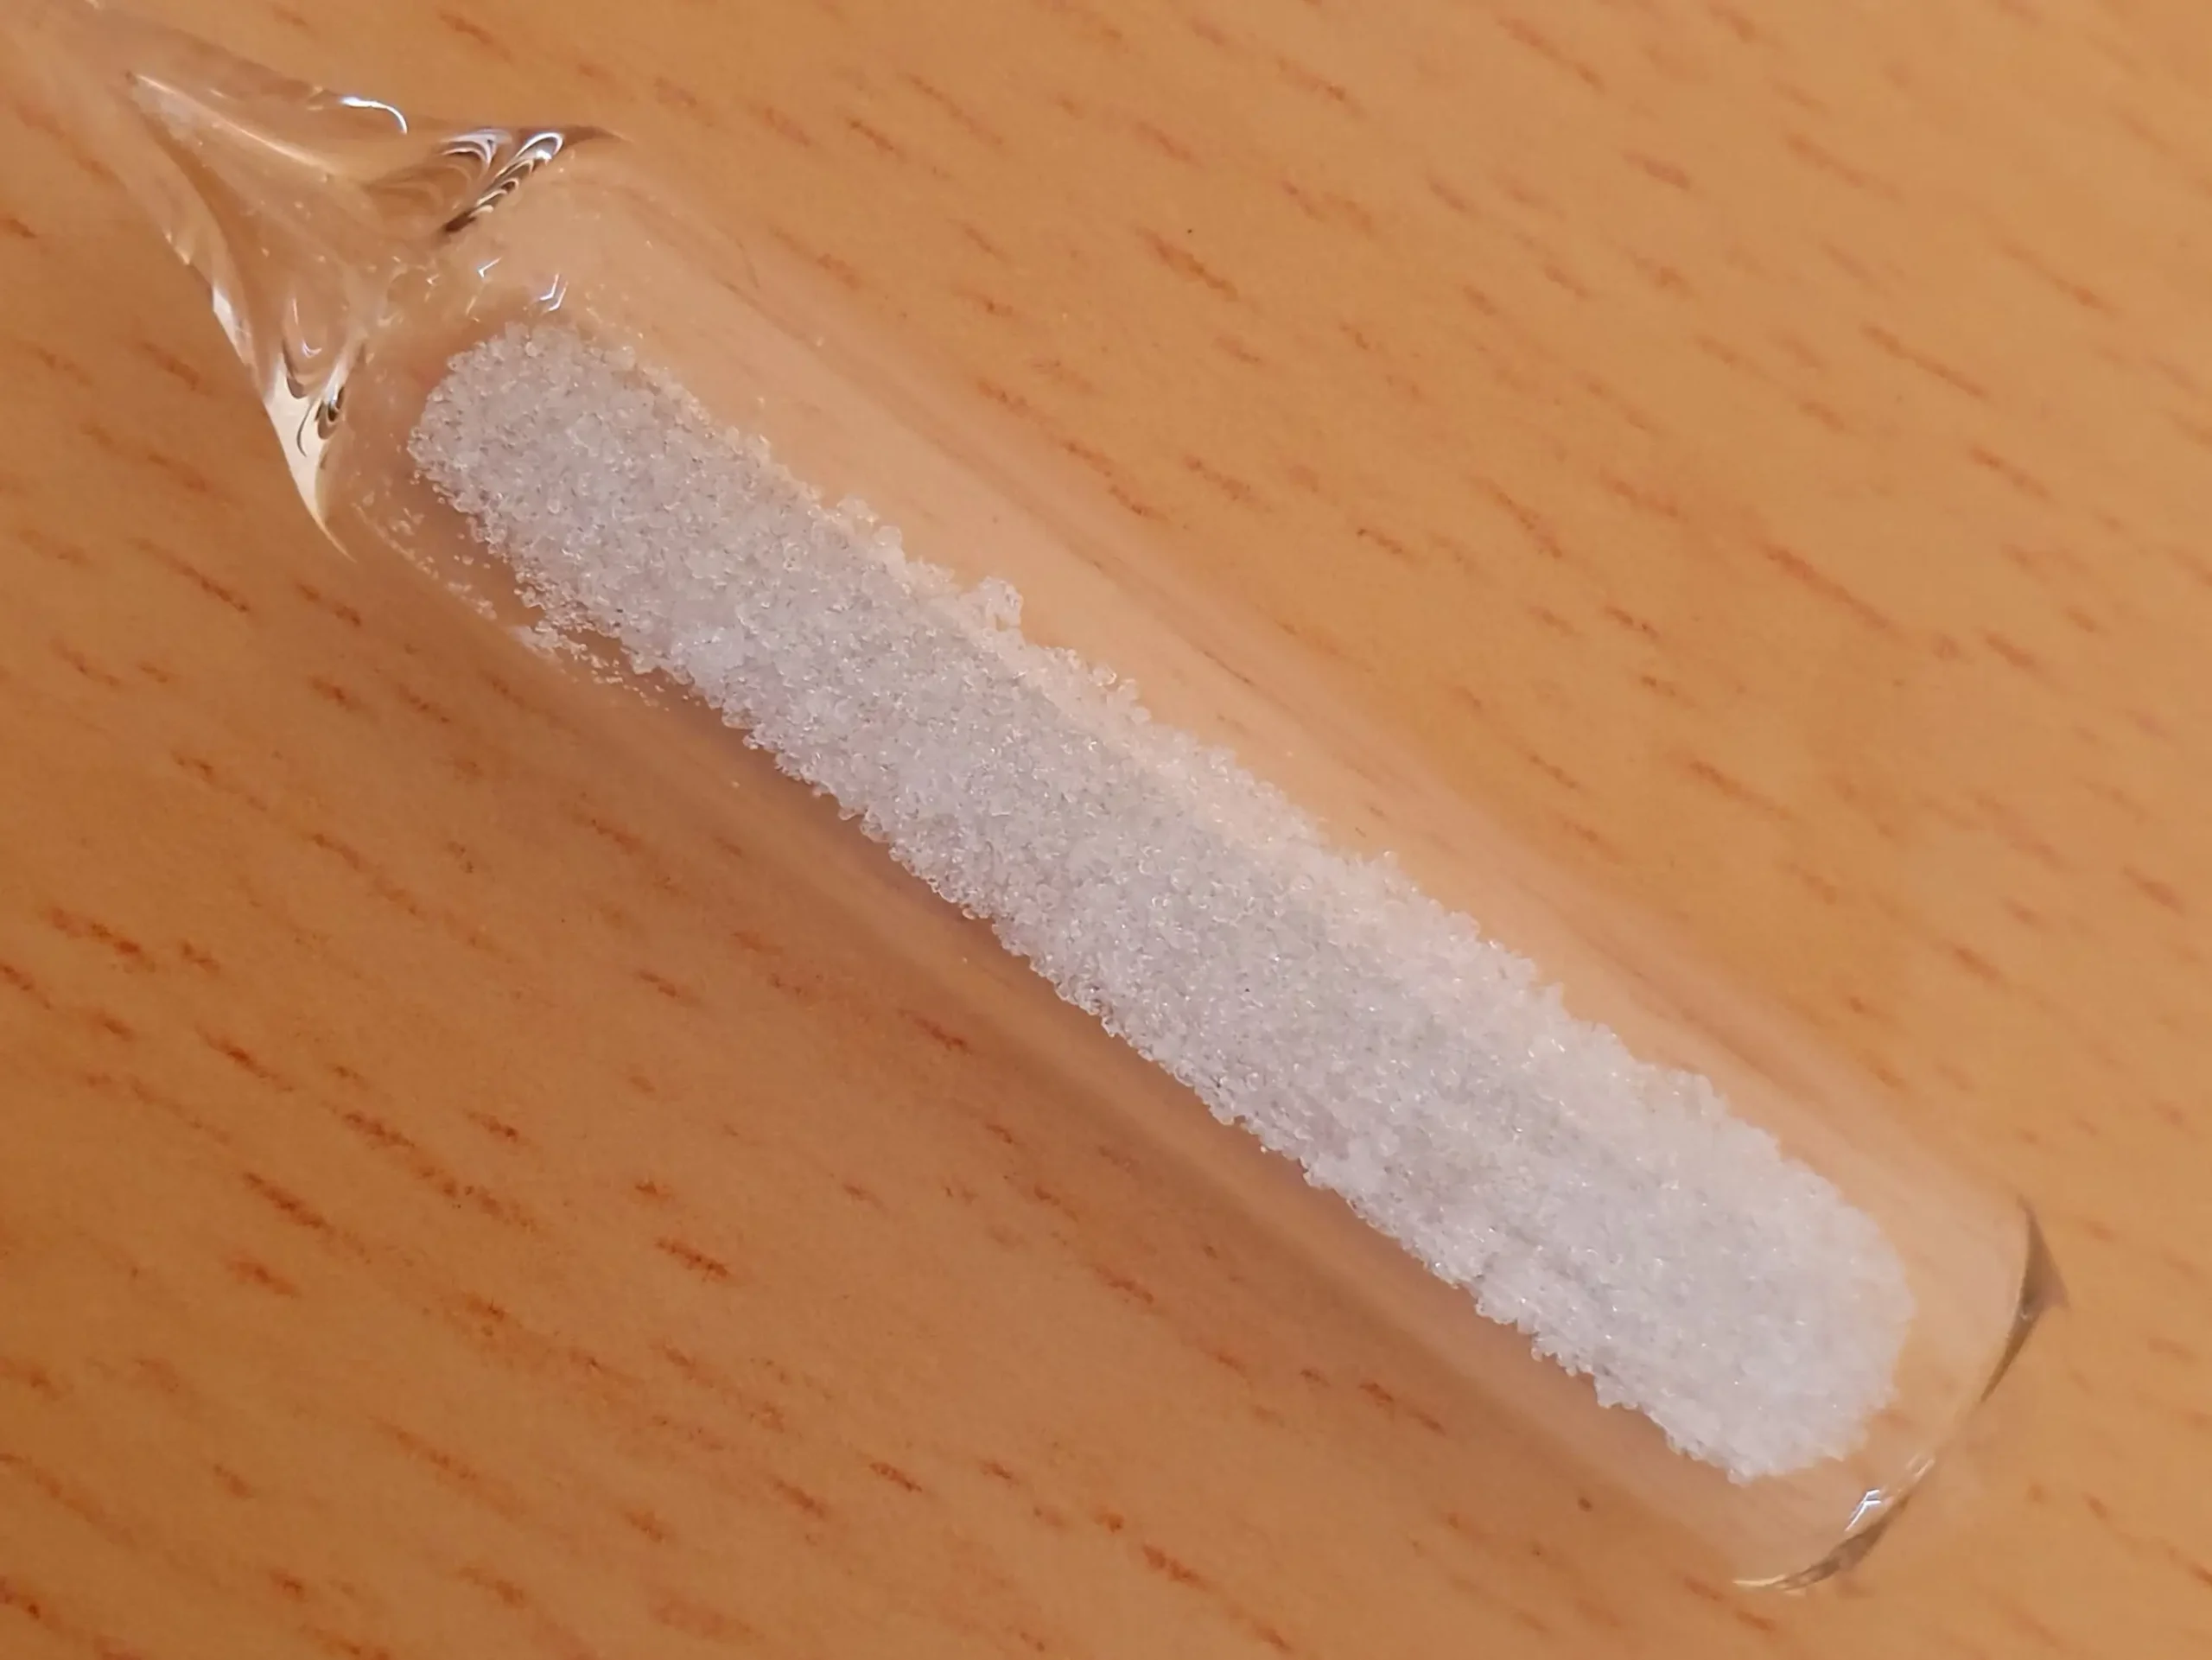
I have no information as to the manufacturing or the sealing process for this sample. Whether the crystals were dried beforehand to remove moisture, how high a vacuum was applied to evacuate the tube before sealing; these are both unknowns. The only information from the manufacturer is that it was advertised as “high purity cesium chloride under vacuum”. Presumably the company are more interested in demonstrating the formation of F-centre colour changes to potential customers, rather than exploring the spectroscopic nature of this rather enigmatic glow.
However, since I trained as a chemist and spectroscopist, I am more interested in the actual spectrum of this curious emission. The colour change is fascinating and pretty, but a spectroscopic investigation of this effect is of more personal interest.
The comment from one of my readers that this could well be contamination from CO is therefore entirely reasonable and relevant. It is quite possible that this could have happened during sample preparation. What lends support to this possibility is that the position of the peaks, and also their relative intensities in this low resolution spectrum of Fig. 1 look suspiciously like the Angstrom bands of CO. It should be emphasized, however, that a correspondence in wavelength does not necessarily lead to a confirmatory chemical identification. There are many instances in atomic and especially molecular spectroscopy where lines and bands that seemingly correspond to one atomic or molecular species, turn out, after closer inspection and further analysis, to be due to another chemical entity entirely. So this apparent wavelength matching may just be accidental.
Firstly, here’s a little background on the Angstrom Bands…
The Angstrom Bands of CO
The Angstrom bands are a series of lines in the visible spectrum from carbon monoxide (CO). They are named after the great Swedish physicist Anders Jonas Ångström, from whom we have the Ångström unit of wavelength. An example showing the Ångstrom bands is depicted in blue in the picture below, taken here from work by Persson and Bergland (see Ref.1).
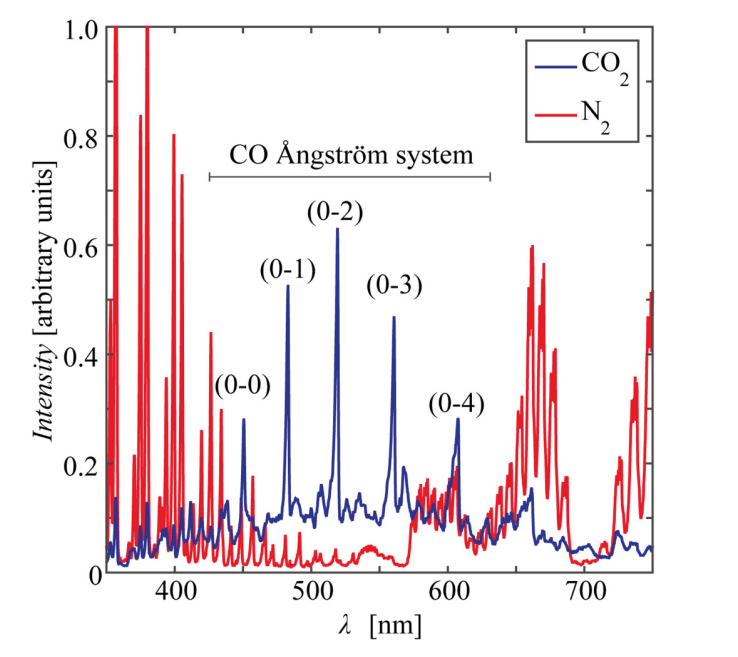
The bands are a series of vibronic (vibrational-electronic) transitions from two different electronic states of the CO molecule and assigned to the B1Σ+→A1Π electronic transition. [If you are unfamiliar with these odd looking Greek symbols (called term symbols in the jargon of spectroscopy) and why they are used, a good explanation is provided here.]
Literature wavelength values for these bands, compared with my own experimentally measured wavelengths from the spectrum of the glow appearing above the CsCl crystals, are summarised in Table 1 below. I have added their possible vibrational level assignments,
Table 1. A Comparison of Literature and Observed Emission Band Wavelengths
| Literature λ (nm) (From Ref 2) | Transition Involved (v’ → v”) | Measured λ (nm) |
| 561 | 0→0 | 560.2 |
| 607.9 | 0→1 | 606.2 |
| 519.8 | 1→0 | 518.5 |
| 560.8 | 1→1 | 560.2 |
| 609 | 1→2 | 606.2 |
| 483.5 | 2→0 | 481.6 |
| 518.3 | 2→1 | 518.5 |
| 558.7 | 2→2 | 560.2 |
| 451.1 | 3→0 | - |
| 481.9 | 3→1 | 481.6 |
| 516.6 | 3→2 | - |
| 422.5 | 4→0 | - |
| 450.5 | 4→1 | - |
| 421.7 | 5→1 | - |
Examining the measured valu column in Table 1 it is clear that a number of peak assignments (which correspond to different vibronic transitions and band heads) are possible. For example, the 0→0 and 1→1 transitions occur at almost the same wavelength, 561.0 and 560.8 nm. As a result, my observed peak at 560.2 nm may be due to two band heads, one “hidden” under the other and not resolved. The spectrum in Fig. 1 was obtained at low resolution, covering the whole visible range and the near UV from 360 nm to greater than 660 nm.
Therefore we must explore further using higher resolutions around each of these emission bands to hopefully reveal more detail. Much more of that to come later.
Is this Molecular Chlorine Cl2?
Another reader commented that the glow could be due to neutral diatomic chlorine, Cl2. In an electrical discharge over caesium chloride crystals, Cl atoms are continuously produced by reactions such as
CsCl → Cs + Cl,
or by CsCl + e– → Cs + Cl + e–.
Recombination of atomic chlorine can then occur through the reaction
Cl + Cl + M → Cl2 + M.
M, here, is some third body. It represents any nearby atom or molecule that can absorb the excess energy released when two chlorine atoms join to form a chemical bond and prevent the same atoms from dissociating again. M could even be the walls of the container, or the surface of the caesium chloride crystals themselves.
On one occasion I was trying to record the spectrum and the heat generated by the discharge cracked the vial! Immediately the strong, pungent smell of chlorine gas was apparent. So it is clear that considerable amounts of Cl2, or perhaps some other chlorine-containing species, are being formed in the discharge.
A gas phase plasma produced from a high energy discharge of a solid alkali halide such as caesium chloride (CsCl) can contain a number of possible emission candidates. Metal halides are well known to produce molecular band systems in electrical discharges and there are quite a few spectroscopic studies in the literature. Most of these, though, have focused on the UV and IR regions. If we list the potential atomic and molecular species available to generate the emission spectrum above, we have quite a few candidates:
Cs* • Cs⁺ • Cl • Cl* • Cl₂ • Cl₂⁺ • CsCl molecules • plus trace impurities from N₂, O₂, H₂O and CO₂
The * refers to an electronic excited state.
It is evident that an attempt to identify the nature of these emission lines is going to require examining the discharge at much higher spectral resolution.
The Spectrum with a 1200 Groove/mm Grating
Doubling the spectral resolution means that the free spectral range of the spectrometer is reduced, but the advantage is that we can see more detail. The spectrometer I am using for this analysis, and the previous ones on CsCl glow emission, is my trusty Oriel-Newport MS125, which has been described in detail here and much more recently here. At 1200 lines per mm, the wavelength range covered is around 150 nm.
Here is the resulting spectrum of the caesium chnloride glow at 1200 resolution:
If we zoom in to examine the two emission lines around 560 and 610 nm, we begin to see some potential fine structure, labelled very tentatively here, since this could well be instrumental noise:
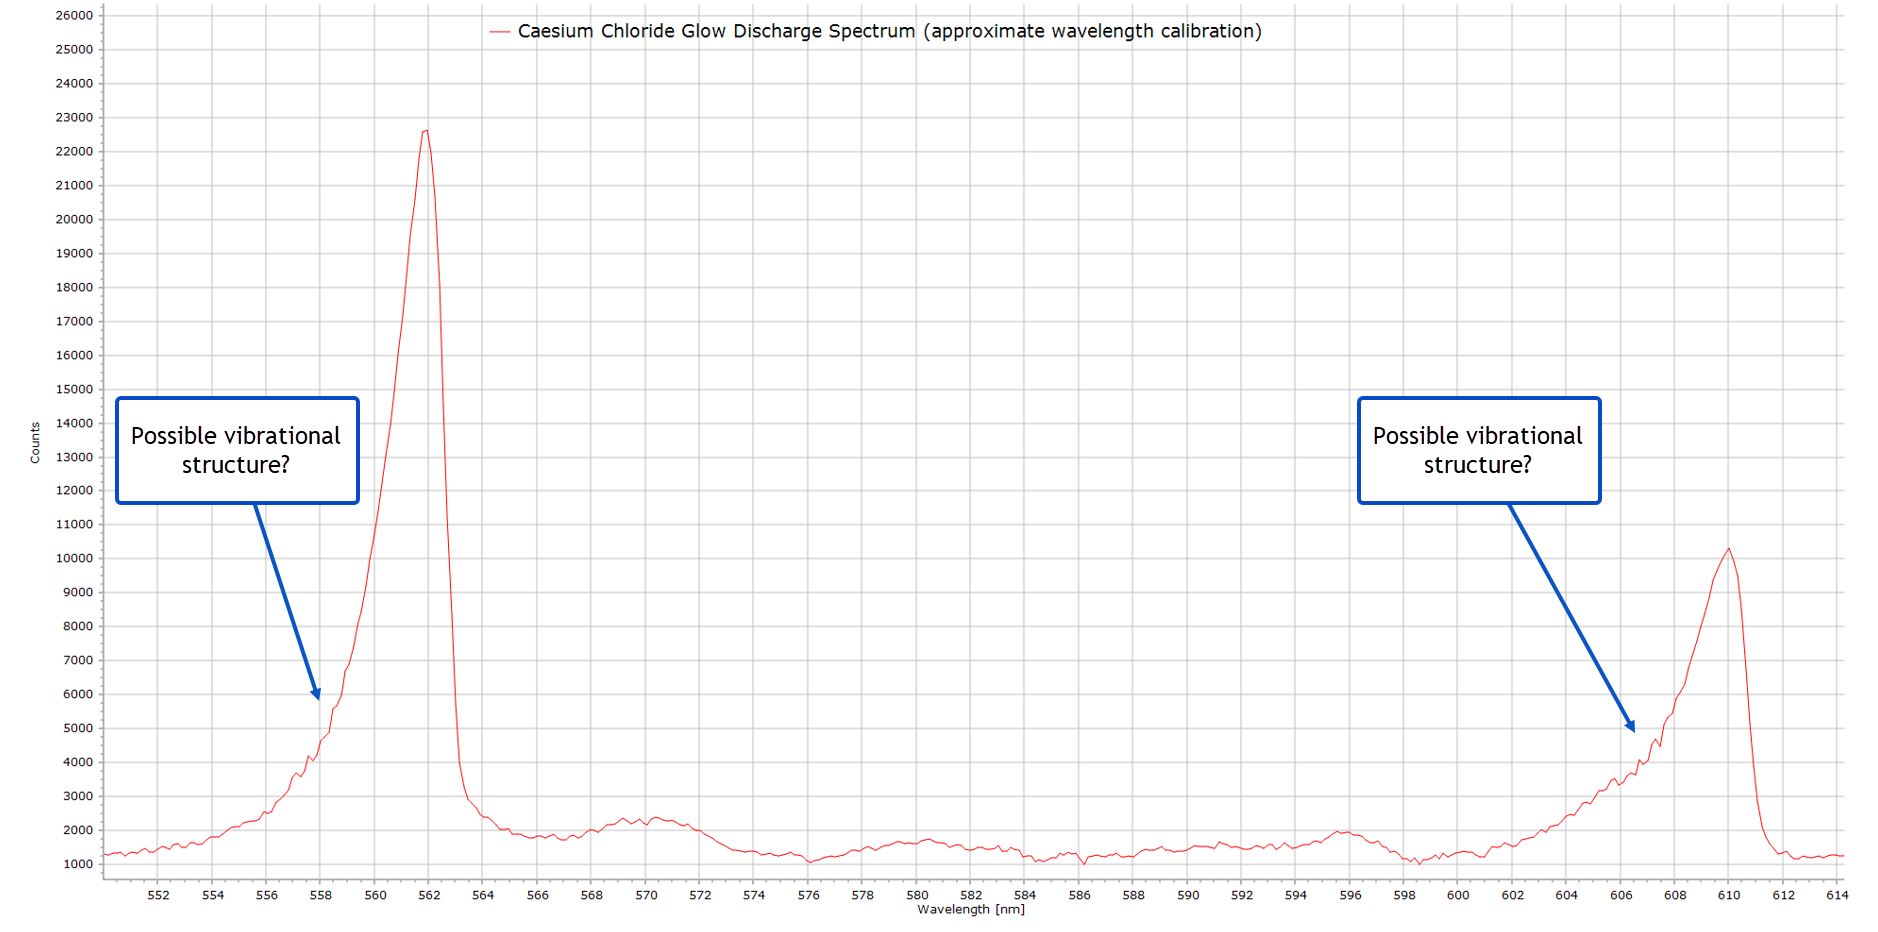
One thing is clear from Figs. 2 and 3: The peaks are all asymmetric, with a gradually rising wing on the blue side of each peak, and a sudden sharp drop on the red edge. Although visible to some extent in the low resolution spectrum, this is far more apparent with the 1200 grating. This line shape lends a good degree of support to the idea that we are probably seeing molecular band systems. Atomic emission lines do not behave in this way. The widths of atomic emission lines are significantly narrower, and in particular, are highly symmetric. This is not the case here. So my initial tentative assignment of neutral and charged caesium and chlorine atoms in the previous post update becomes very unlikely. The peaks therefore are probably molecular in origin. The question is: which molecule, Cl2, CO or something else?
It is clear that an attempt to identify the nature of these emission lines is going to require examining the discharge at much higher spectral resolutions. we must push spectral resolution even more, and look for any vibronic structure currently hidden under the bands.
The results from the higher resolution work form Part 2 of this investigation. The spectra will be presented, together with a detailed discussion and analysis.
Coming soon to Steve’s Open Lab!
References
- “Microplasma emission spectroscopy of carbon dioxide using the carbon monoxide Ångström system“, A. Persson & M. Berglund, J. App. Physics, 127, 064502, (2020).
- “The Band Spectrum of Carbon Monoxide“, National Bureau of Standards, NSRDS-NBS5, 1966.


2 thoughts on “Another Look at Light Emission from Crystals – Part 1”
As i mentioned earlier somewhere, the molecular bands are definitely the CO-Angström bands, whereever CO came into the tube. With higher resolution you will resolve the rotational structure of the vibronic bands.
By the way. I have recently done spektra from the CsCl Tube from Smart Elements. I have seen many Cl atomic lines and only the two most prominent Cs lines in the 850-890 nm region.
Franz Bolduan
Hello Franz, I am not sure we should definitively assign the bands to CO at this early stage. I agree that the Angstrom bands bear a close similarity to what is observed in this CsCl discharge. However, another possibility is Cl2+. Cl2+ must be produced in the discharge in appreciable quantities and will be in large excess, compared to CO which can only be present as a trace impurity from an inadequate vacuum during manufacture. I appreciate the Angstrom bands can be intense, but recent work by Bob Field and coworkers, as well as the classic early work by Elliot & Cameron suggests very clos correspondence in wavenumber to what is being seen here.
I am currently recording the spectra of this discharge with a higher resolution grating 2400 grooves/mm. This should bring out more of the vibrational structure, but rotational levels will be left hidden. One possibility too is to consider the effects of the different C35 and C37 isotopologues if feasible, which would suggest a chlorin-containing emitter. I am constructing a spectrograph with a theoretical resolving power of about 15-16,000. But completion of this instrument is still a few months away.