The answer to that question is yes, most definitely! Pure olive oil contains a number of molecules, chlorophyll for example, that fluoresce under UV light and even some wavelengths of visible light.
Here’s a short video that demonstrates this…
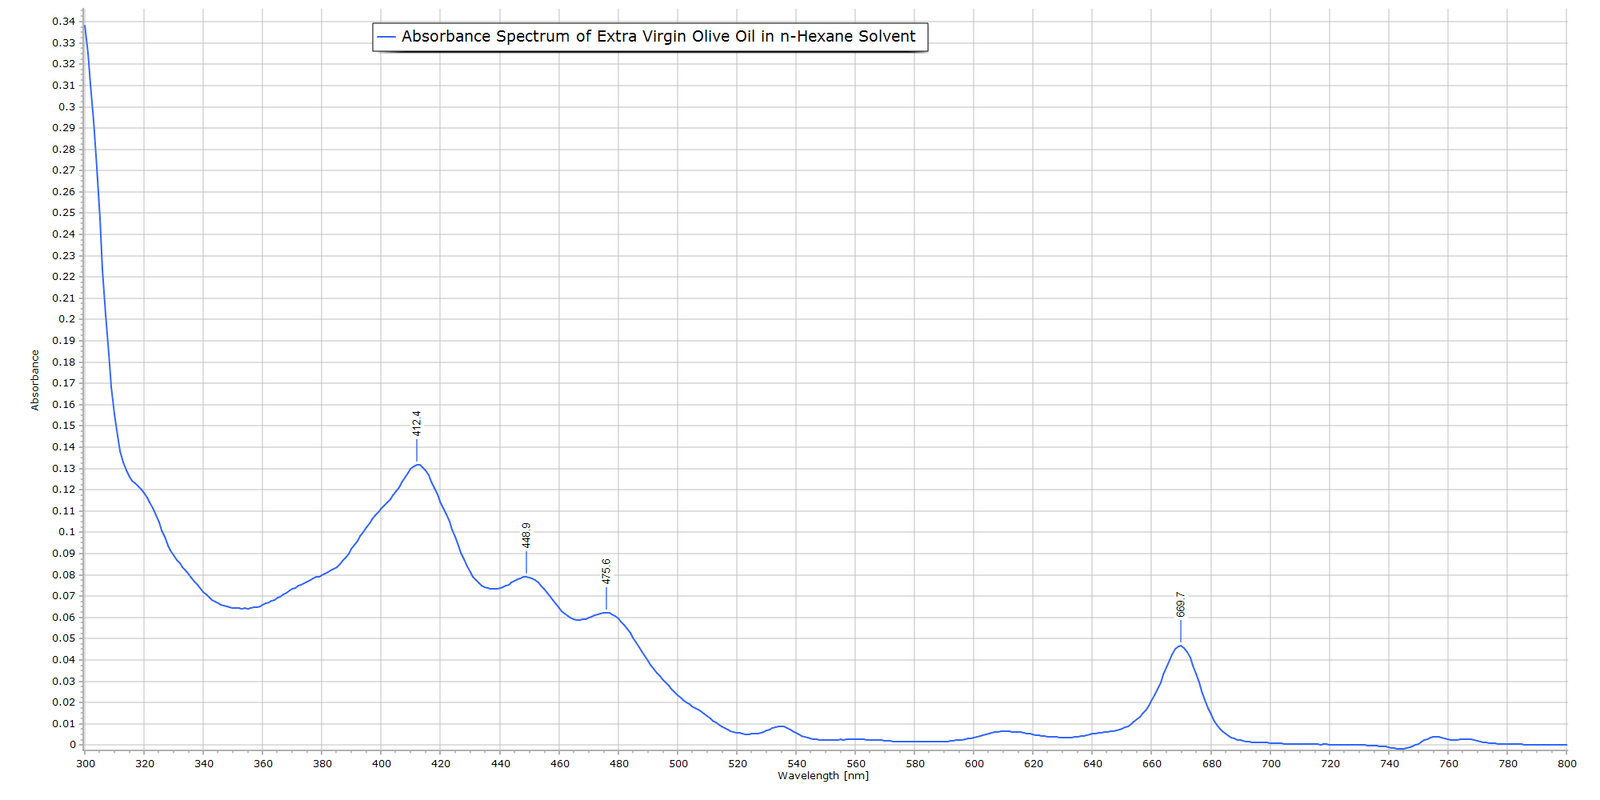
To see what’s going on here in more detail, we need first of all to look at where olive oil absorbs light. Here is the absorption spectrum of a dilute solution of pure olive oil from 350 nm to 800 nm:
Fig. 1 Absorption Spectrum of EVOO from the UV to the Far Red
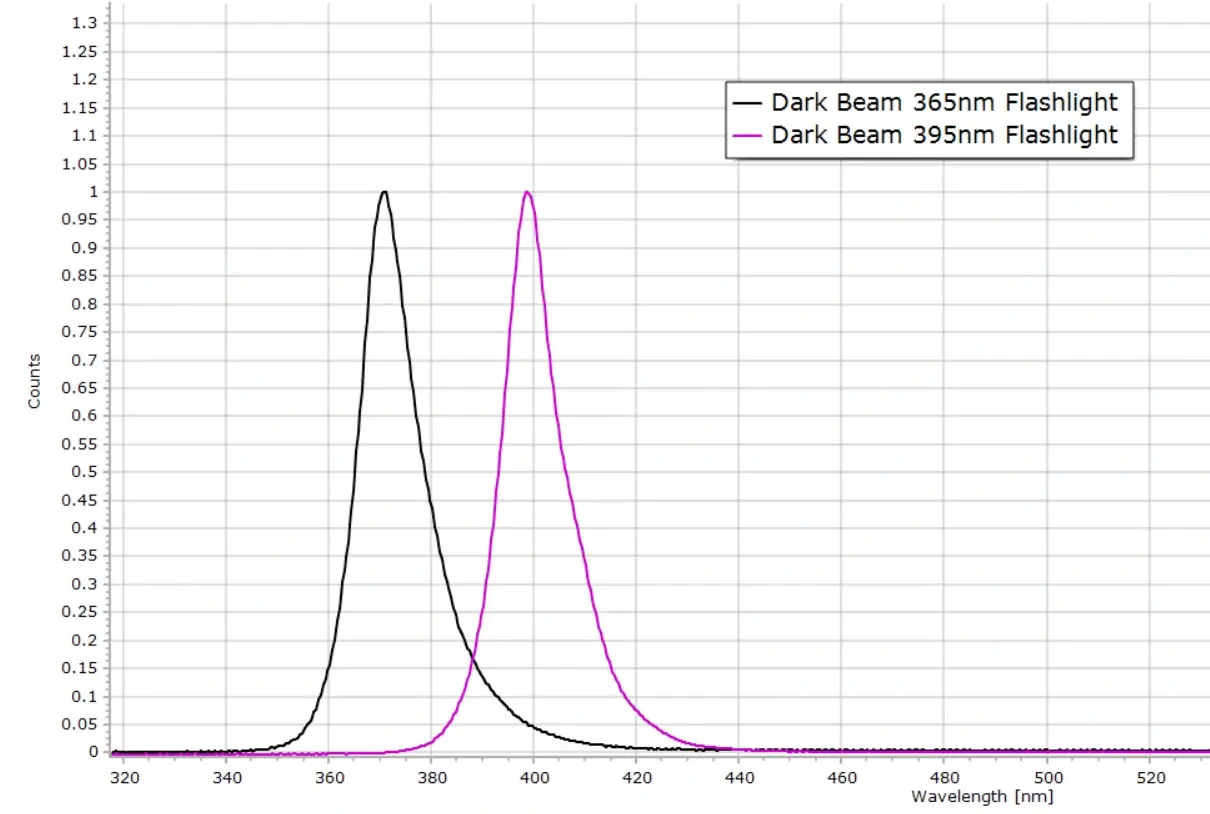
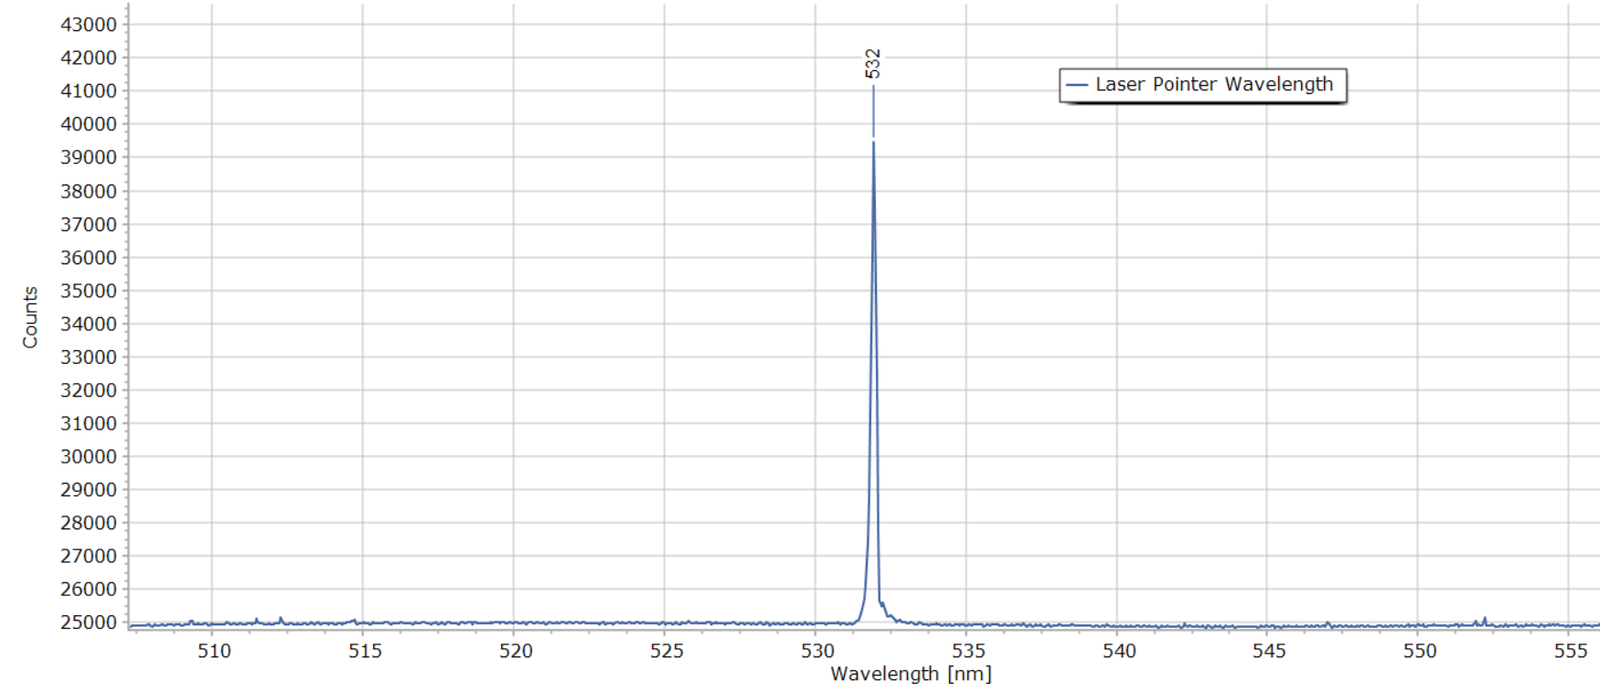
The green laser used in the above video has a wavelength of 532 nm. This wavelength is only weakly absorbed by chlorophyll as shown in the above spectrum. Nevertheless, the intensity of excitation light from the laser is enough for us to observe a fairly strong fluorescent signal visually (the red beam passing through the oil). When we change to the UV LED lamp, vibrant red fluorescence from chlorophyll becomes very intense due to the much increased light absorption in the UV. Two examples of these UV “blacklight” lamps are shown in Fig. 2. In the video, the one emitting at around 400 nm was used. Both lamps have relativley broad emission bands spread over several wavelengths, typically 10 nm. All these wavelengths can be absorbed by olive oil, accounting for the much stronger fluorescence. The green laser, on the other hand, emits almost monochromatic light with a linewidth of < 1 nm as shown in Fig. 3.
Fig. 2 Blacklight UV Lamp Emission Bands
Fig. 3 Line Emission from a 532 nm Laser Module
The actual energy change and electronic transition involved is, in fact, the same. (Enthusiasts of technical details can check the explanation at the end of this article.) In addition to chlorophyll, with its beautiful and vibrant red fluorescence, there are a number of other organic molecules present in olive oil that fluoresce in the blue and also the near UV that we usually cannot see. In this article I am going to explore all these constituents of olive oil and obtain their absorption and emission (fluorescence) spectra.
But first, here’s a few words about olive oil in general…
The Different Grades of Olive Oil
We are all no doubt aware of the excellent health benefits of consuming olive oil in a balanced diet. Olive oil quality is mainly determined by how the olives are grown, harvested, processed, stored, and graded. The highest (and most expensive) quality is Extra Virgin Olive Oil (EVOO), which is typically mechanically extracted in one single pressing process and is of low acidity. The label “Olive Oil” is attributed to product of good general quality but with a higher acidity and fewer favourable organoleptic properties. It is nevertheless generally high in overall quality. Below that, we have the label “Refined Olive Oil”. This is of lower quality that has been chemically or thermally refined. It is less green and more yellow in colour, milder in taste and less flavourful. Then there is the product of blended olive oil, which is a mix of the refined oil and virgin/extra virgin oil. The lowest quality category of all is Olive-Pomace oil, an oil extracted from olive-pressed residues using solvents which is then further processed.
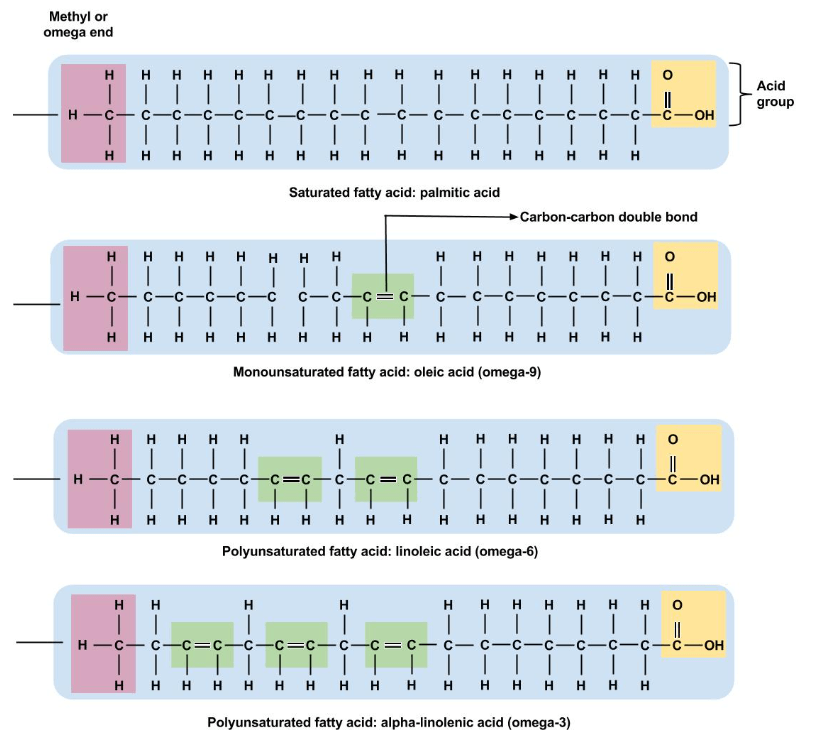
Nevertheless, all natural vegetable oils can degrade in quality over time, EVOO included, either by thermal oxidation through heating/cooking or by photooxidation through prolonged exposure to light. The latter is one reason why EVOO on supermarket shelves is always stored in dark green plastic or glass bottles. That being said, EVOO is considered to be one of the more stable of the vegetable oils. This is due to its chemical composition, which contains a high proportion of the mono-unsaturated fatty acid oleic acid (up to 70%) and low amounts of poly-unsaturated fatty acids (~ 10%) relative to other types of cooking oils. Polyunsaturated fatty acids are more susceptible to oxidative processes owing to the higher proportion of C=C double bonds.
A reminder of the different types of long chain linear fatty acids is shown in this chart
Besides fatty acid content, additional stability of EVOO is provided by the high level of polyphenols in the oil that possess strong antioxidant properties, small amounts of α-tocopherol (a type of vitamin E), carotenoids, sterols and other minor compounds.
That’s a quick summary of the different grades of what is really an excellent consumer cooking oil. Considered overall, olive oil is one of the few vegetable oils that has the advantage of being eaten in its natural state without cooking. As mentioned earlier, it can be produced by the simple mechanical means of cold pressing olive fruit and removing the skins. The highest quality oil is unrefined and is best used as a salad dressing or in low temperature cooking, which avoids destroying beneficial natural antioxidants present in the oil, such as compounds called polyphenols.
With that background covered, we can now move on to consider the fluorescence properties of these molecules in olive oil. Therfore the remainder in this article is limited to extra virgin olive oil (abbreviated to EVOO), its fluorescence properties and spectra.
The Fluorescent Molecules in Olive Oil
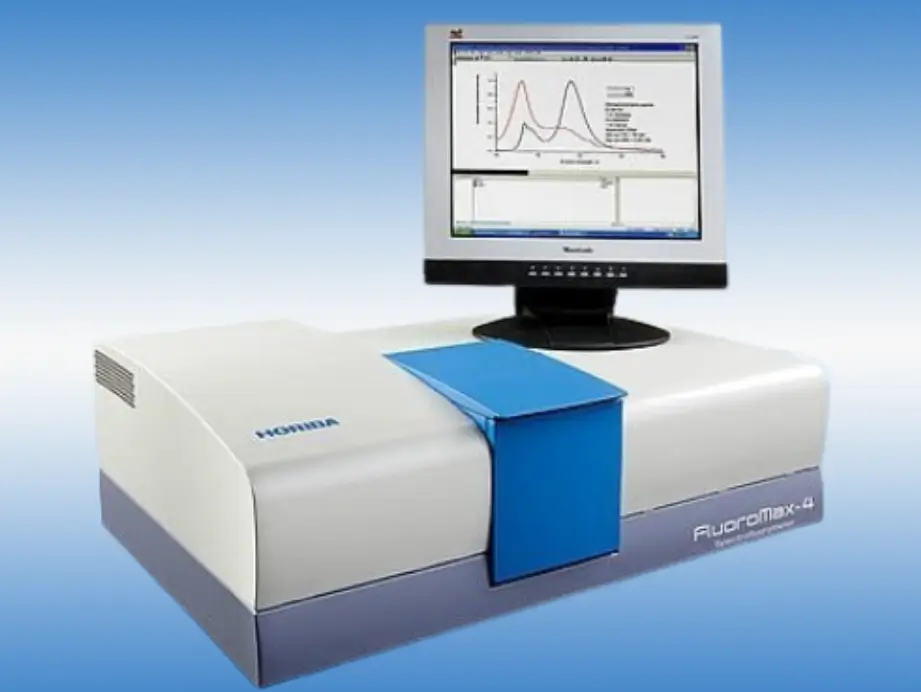
All fluorescence spectra in what follows were obtained using a Horiba Fluoromax-4® spectrofluorometer, which has already been described in this article and also here.The excitation and emission monochromator slits were typically set to 5 nm bandpass, with an incremental wavelength step change during a scan of 1 nm.
Chlorophyll
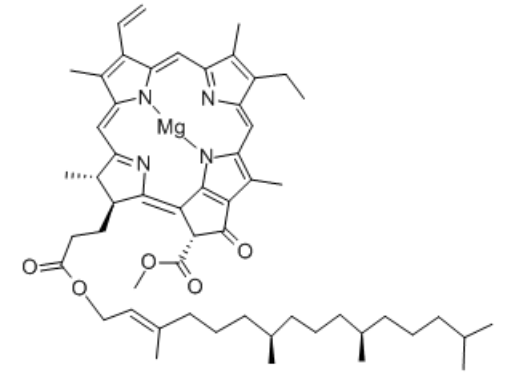
Chlorophyll produces by far the strongest signal in the visible region of the spectrum, as we saw in the video with its deep red fluorescence. This pigment exists in a number of different chemical forms, with minor differences to the organic functional groups attached to the parent structure. The parent structure consists of a porphyrin ring with a central magnesium ion (Mg2+) and a long hydrophobic section called a phytol chain. This is bonded to the porphyrin ring via an ether linkage. Two common structures found in most plants are chlorophyll aand chlorophyll b. The structure of chlorophyll a is shown here:
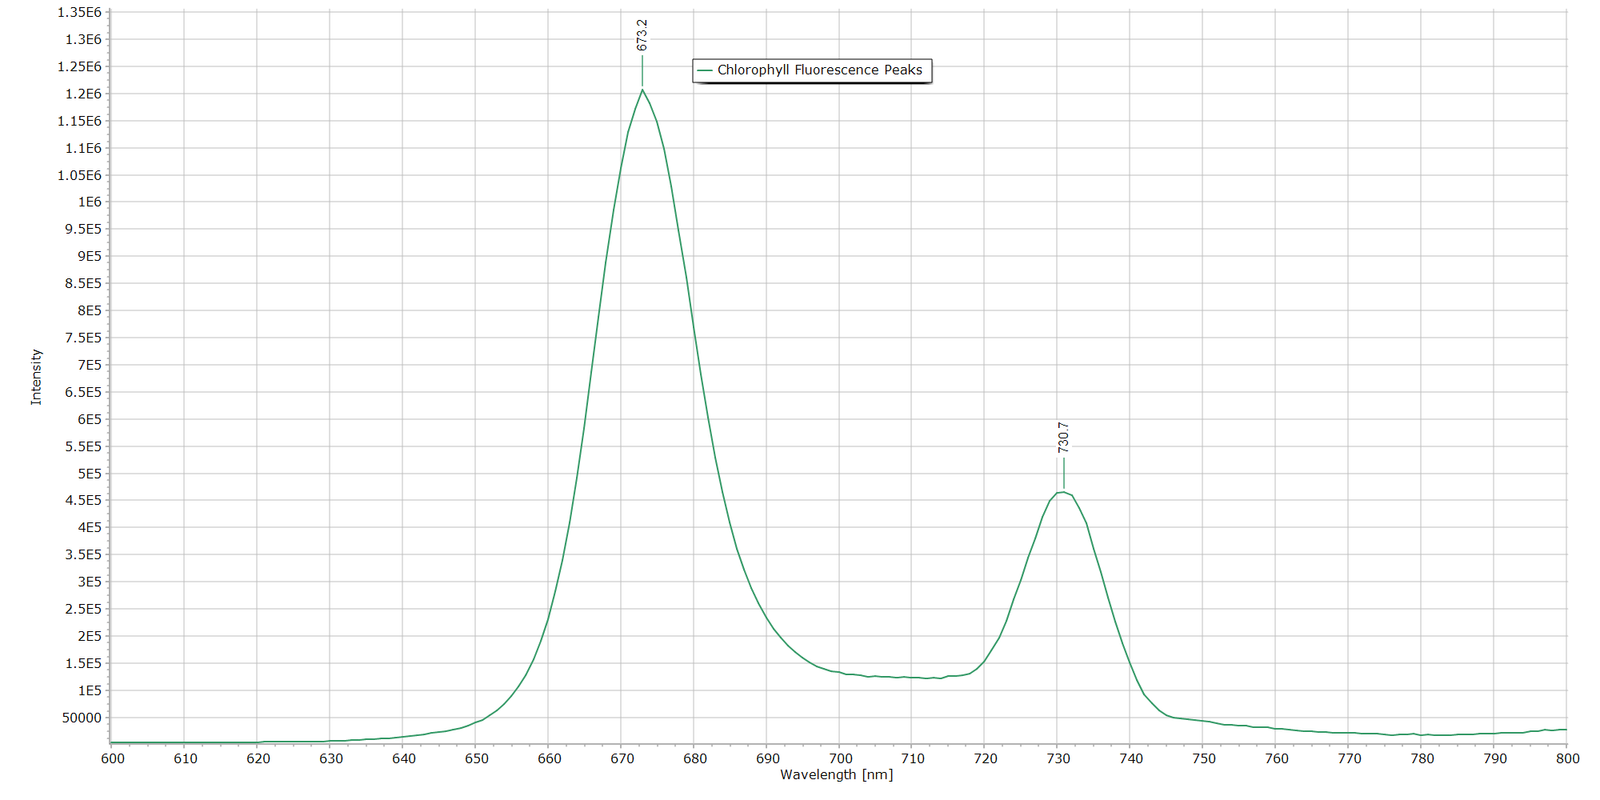
The highly conjugated (alternate C=C double bonds) nature of the porphyrin ring explains why the molecule absorbs light in the blue and red parts of the visible spectrum. As a result, chlorophyll appears green in reflected light (see Fig. 1). The fluorescence spectrum of chlorophyll contained in olive oil can be seen in Fig. 4. The excitation wavelength used was 365 nm.
Fig. 4 - Chlorophyll Fluorescence in Olive Oil Sample. (Only the Left Peak is due to Chlorophyll)
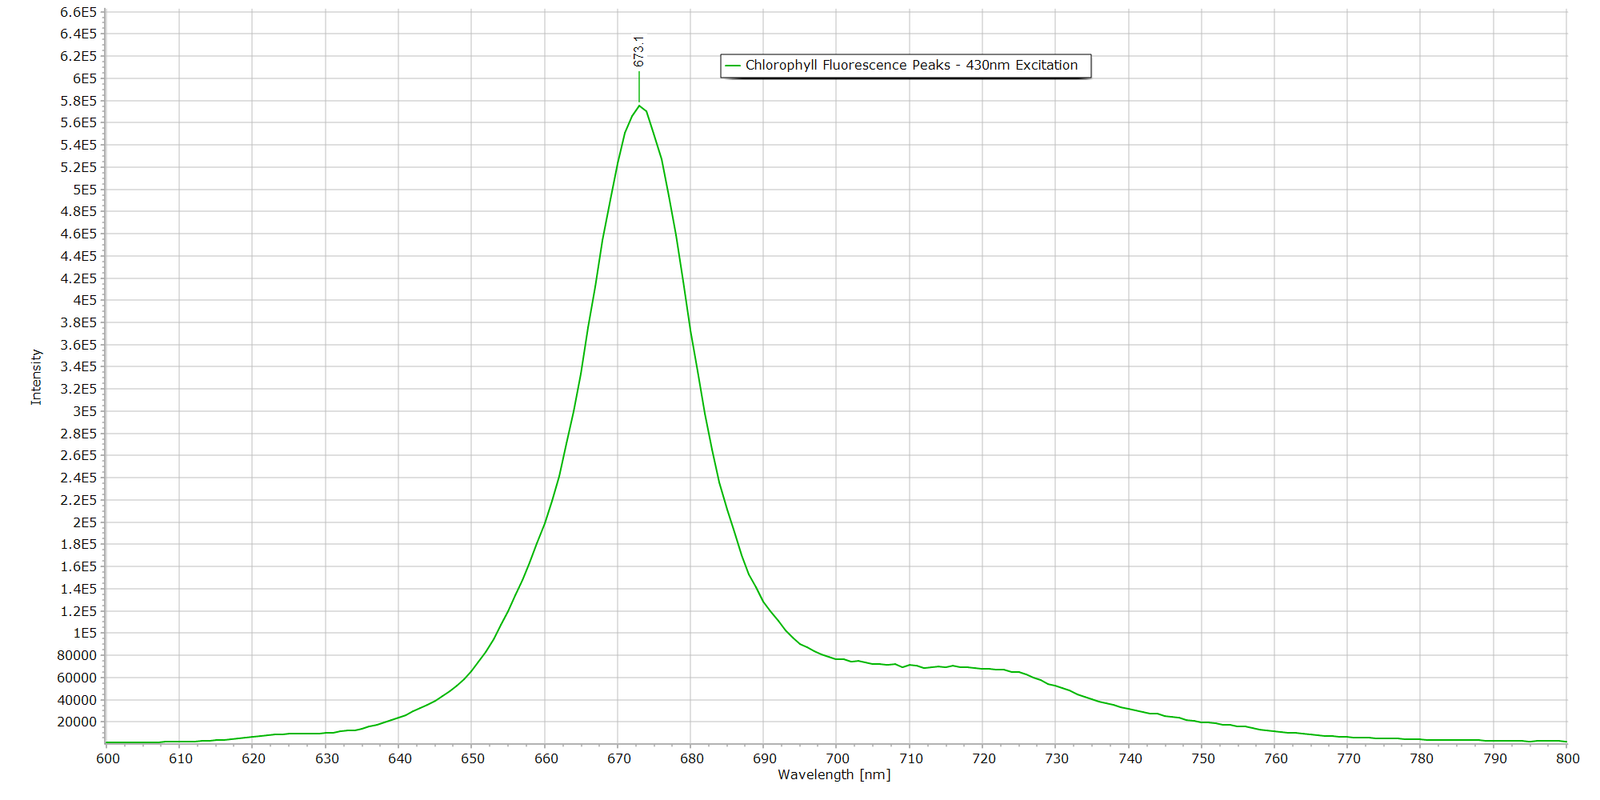
Although I labelled this spectrum as “Chlorophyll Fluorescence Peaks”, only the peak at 673 nm is emission from chlorophyll pigment molecules. The peak appearing at 730 nm is not due to chlorophyll. The most likely explanation is that it is a second-order diffraction peak from the 365 nm excitation light used, rather than a genuine fluorescence band from olive oil. The key clue is the wavelength: the excitation light used was 365 nm, and 2 × 365 = 730 nm which falls precisely on the observed emission peak. This demonstrates that you have to be very careful when interpreting fluorescence spectra with grating monochromators, due to these instrumental optical “artifacts”. Proof that it is indeed a 2nd-order diffraction peak is shown in the following spectrum, where the excitation wavelength has been changed from 365 nm to 430 nm. The peak at 730 nm has now disappeared. In principal, there should now be a second-order diffraction peak appearing at 860 nm (2 × 430nm), but this is outside the spectral range recorded.
Fig. 5 Chlorophyll Fluorescence Spectrum with Excitation Wavelength at 430 nm
The Tocopherols and Vitamin E
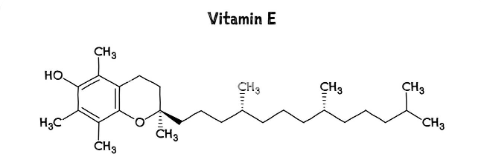
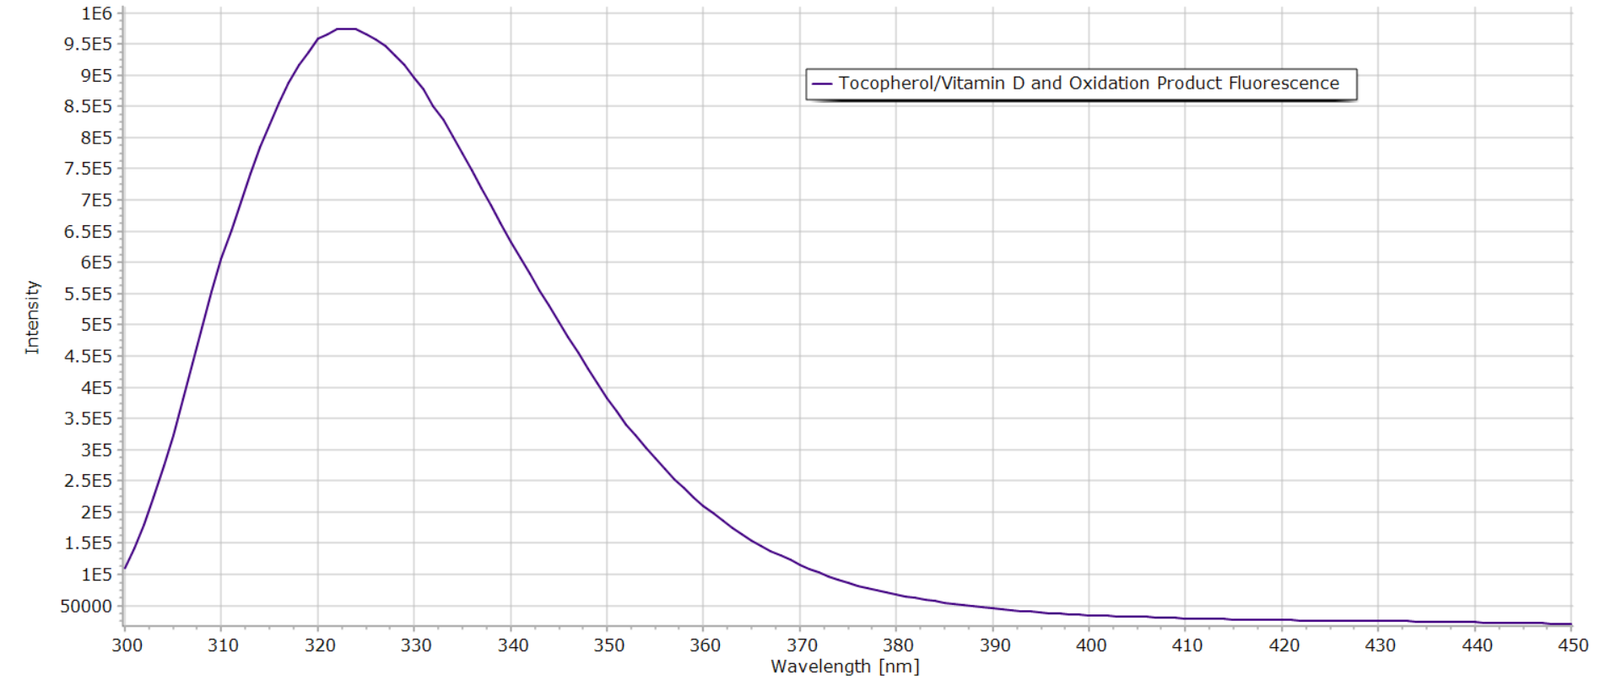
EVOO contains several compounds that have strong antioxidant properties, of which vitamin E is one. The vitamin E “family” is not a single molecular structure. There are 8 similar structures in 2 different forms which define this group of vitamins. These are called the tocotrienols and tocopherols. Both types are oil/lipid-soluble antioxidants. The most common form for us humans, in terms of chemical and biological activity, is α-tocopherol. And this is what we usually refer to as vitamin E. It is a potent free radical scavenger and antioxidant that prevents the propagation of free radical damage to cell membranes in the body. As a consequence of this mix of different vitamin E types,the fluorescence spectrum of a sample of EVOO is likely to consist of contributions from any of these similar chemical structures. All of them fluoresce in the UV in the region of 320 to 330 nm. Here is a spectrum of the same EVOO sample as above, but excited at 290 nm:
Fig. 6 α-Tocopherol Fluorescence Peak of Olive Oil in n-Hexane
The peak emission maximum λmax is ~325 nm but varies between 325nm to 334nm depending on solvent polarity. Furthermore, there may spectral overlap from oxidation products under this peak, which fluoresce in the same wavelength region, depending on the age of the oil sample. The shelf-life of an unopened bottle of EVOO is generally considered to be 1-2 years, whereas an opened bottle of oil is best consumed within 1 to 6 months, preferably 1-3 months for optimum antioxidant value and health benefit.
Exploring Further
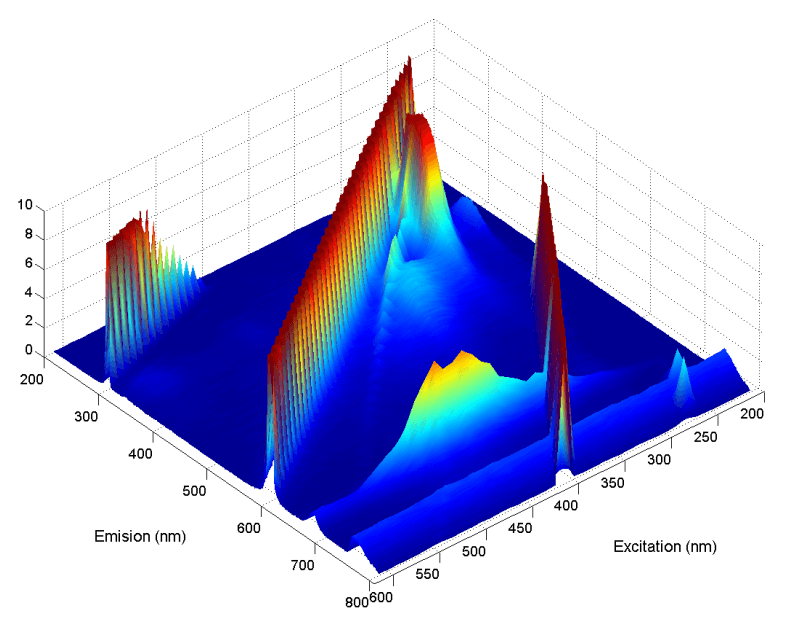
Single-wavelength excitation to generate the emission spectra described above do provide some useful information on the nature of fluorescent species in a multicomponent sample such as EVOO. This information, however, is somewhat limited. Far more informative results can be produced when we generate the Excitation-Emission Matrix or EEM. The EEM has been described in detail in an earlier article for those interested. The technique has become very popular in the professional scientific literature, particularly in food and environmental science. It provides a molecular fluorescence fingerprint or contour map of a sample that contains multiple fluorescent species.
So let’s take a look at some EEM results obtained with the same EVOO sample used above.
The Chlorophyll Peak Region
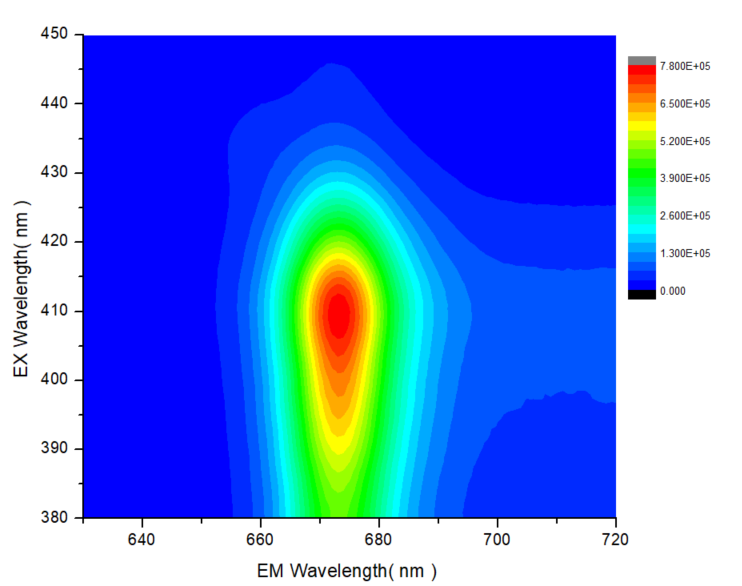
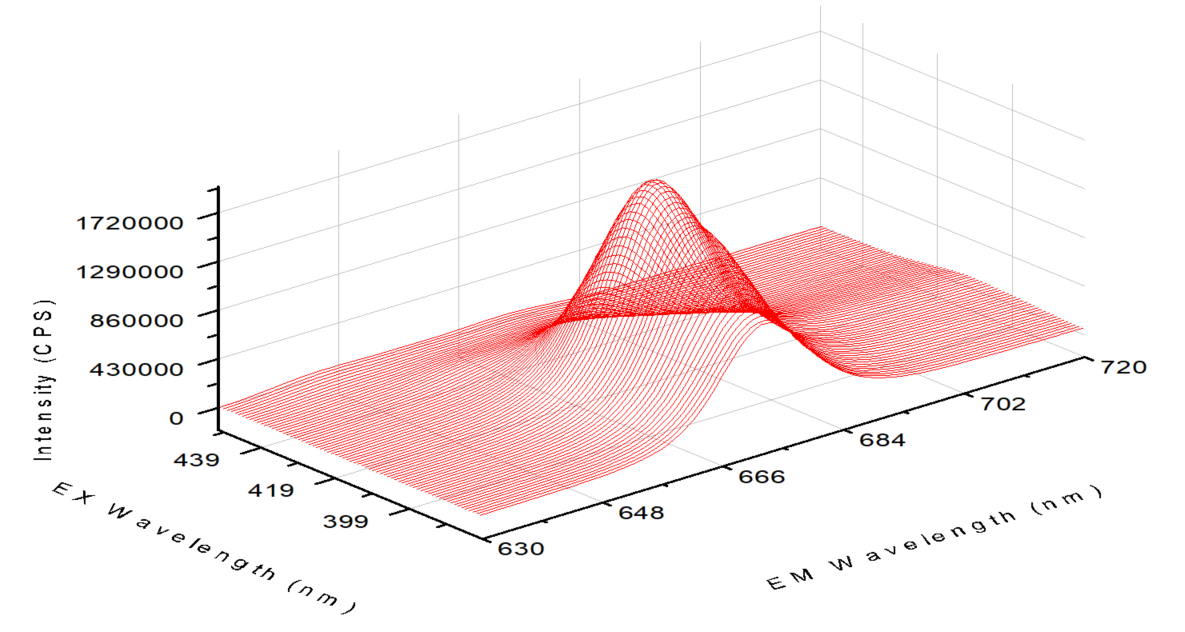
The chlorophyll fluorescence peak region can be seen in Figs. 7A and 7B, both as a contour map and a 3D landscape plot respectively. The data were produced by scanning the emission wavelength of the spectrometer through 630 nm to 720 nm, whilst stepwise scanning the excitation monchromator through the range 380 nm to 450 nm. The strong chlorophyll fluorescence peak at 673 nm from Fig. 1 is now represented as an intensity colour-coded contour with maximum fluorescence at an excitation wavelength of 410 nm.
Fig. 7A
Fig. 7B
The Vitamin E Region
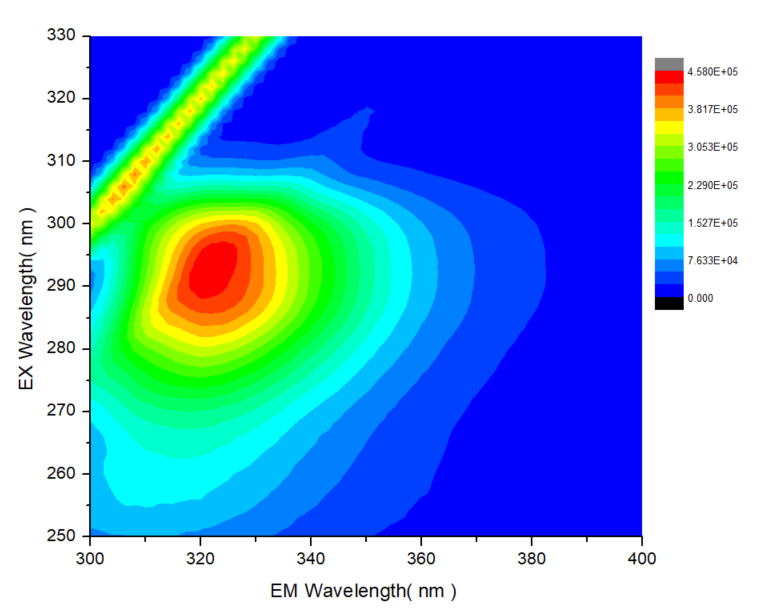
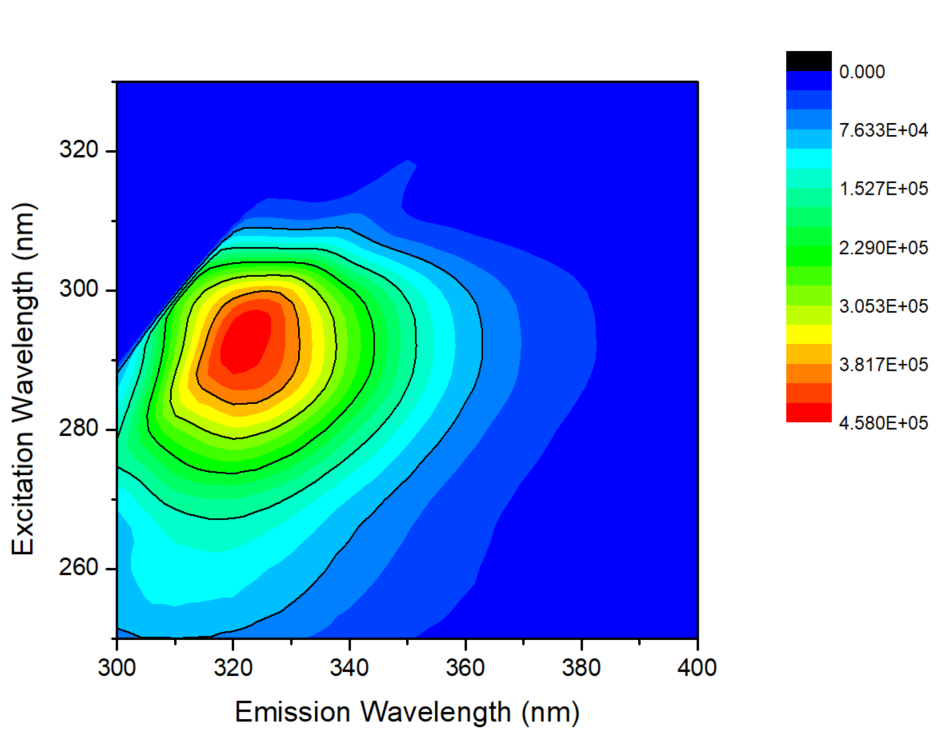
The tocopherol/vitamin E emission peak has a maximum around 325 nm in the UV. The following EEMs were produced by scanning the excitation wavelength over the range 250 nm to 330 nm and the emission monochromator through the range 300 nm to 400 nm. In Fig. 8A a strong 1st order Rayleigh band is present at the top-left corner of the plot, which has been removed by software in Fig. 8B. Removal of Rayleigh and Raman bands in EEMs is the usual practice when reporting EMM data in scientific publications, since these are only optical artifacts. More information on Rayleigh bands in EMMs, and its analogue the Raman band, is provided here.
Fig. 8A
Fig. 8B
The Whole Picture
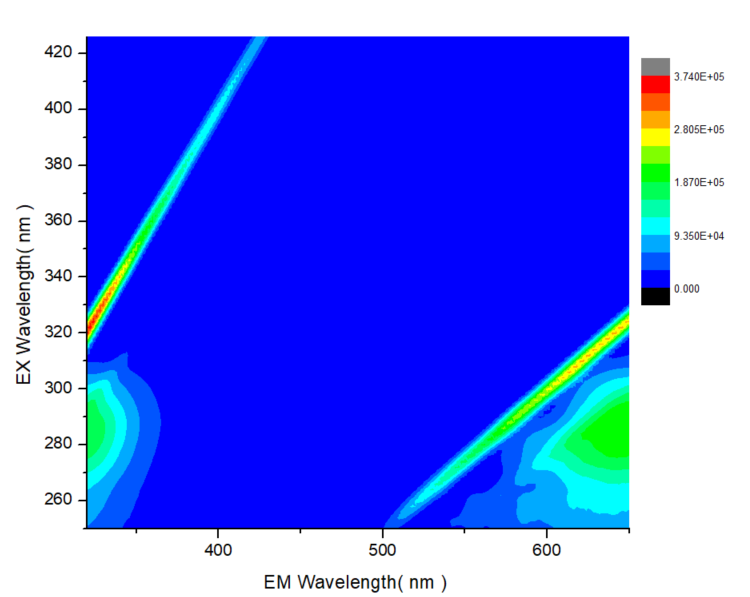
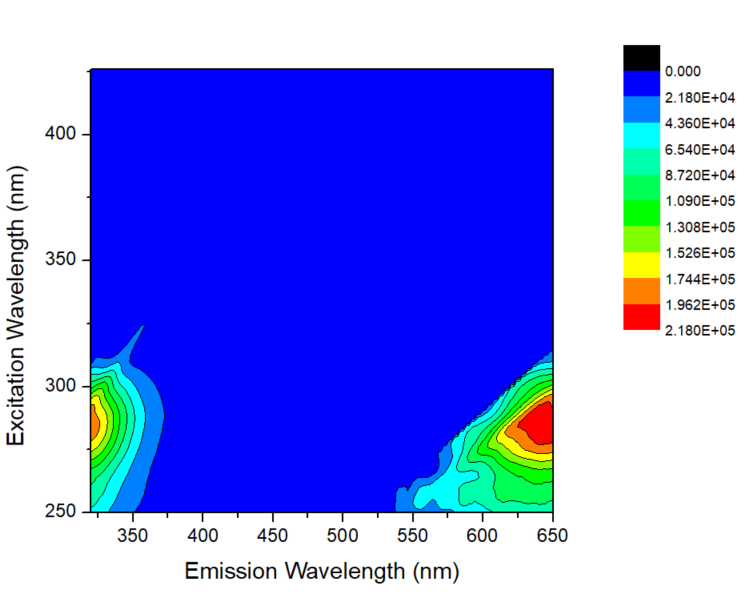
Extending the excitation and emission ranges to cover both the chlorophyll and vitamin E fluorescecne peaks, we obtain the bigger picture featuring both molecules across the UV and visible. Thus we have an effective molecular fluorescence fingerprint for this sample of extra virg showing the presin olive oil (Fig. 9) showing the presence and position of the fluorescence peaks across the whole spectral range.
Fig. 9A
Fig. 9B
In Fig. 9A the two ‘streaks’ are the 1st and 2nd order Rayleigh bands (refer to this article) while in Fig. 9B these have been removed.
For Technical Enthusiasts...
The electronic transition responsible for chlorophyll fluorescence is a \(\pi \to \pi^*\) transition involving the conjugated macrocyclic porphyrin ring of the chlorophyll molecule. This transition occurs between the Highest Occupied Molecular Orbital (HOMO), which represents the ground state (\(S_{0}\)), and the Lowest Unoccupied Molecular Orbital (LUMO), which represents the first excited singlet state (\(S_{1}\)).
It is a spin-allowed transition, meaning the electron does not flip its spin during excitation or emission. The ground state (\(S_{0}\)) and the excited state (\(S_{1}\)) both maintain a total net spin of zero (paired electrons). Because spin is conserved, the transition probability is high, resulting in a short excited-state lifetime \(\tau\) of 1-5 nanoseconds.
Final Words...
This concludes my first look at the intrinsic fluorescence of Olive Oil. Future articles may compare olive oil to other vegetable cooking oils and fats and examine their relative stability under thermal stress and prolonged UV exposure.
Coming soon to Steve’s Open Lab…
Add Your Heading Text Here
From the Laboratory Notebook at Steve's Open Lab
Steve’s Open Lab documents instrument development, independent lab investigations and practical scientific demonstrations. Some articles describe complete experiments, while others record progress in longer-term research projects as new observations become available. Whether you’re looking for a quick experiment or following an ongoing investigation, I hope you’ll find something here that sparks your own curiosity.