IR Spectra of Common Pharmaceutical Drugs and Supplements

⏱️ 14 minute read

Introduction

I introduced the infrared (IR) spectrometer in a three-part article early last year. You can refer to those posts on its historical development (in Part 1), on the modern day Fourier Transform spectrometer (Part 2) and on several accessories used to record IR spectra of different sample types (Part 3).

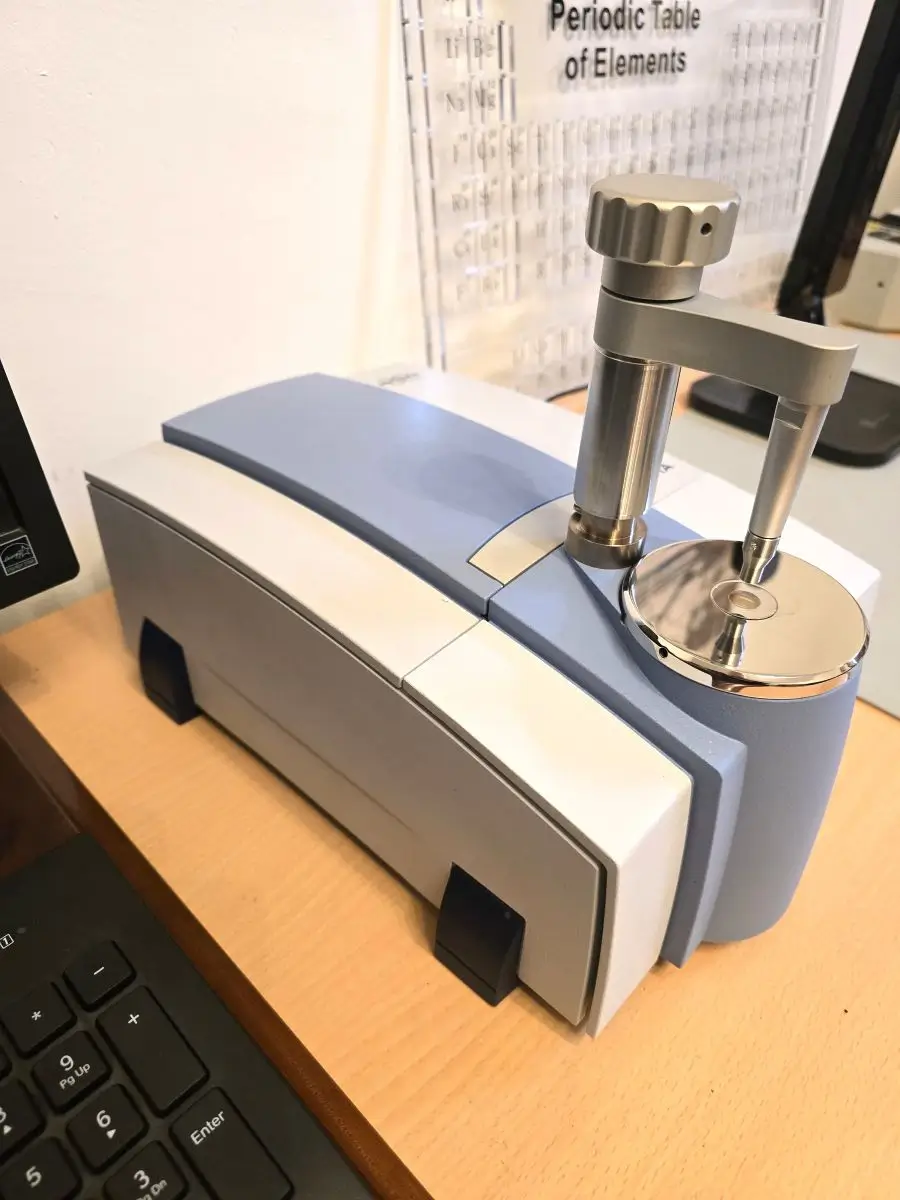
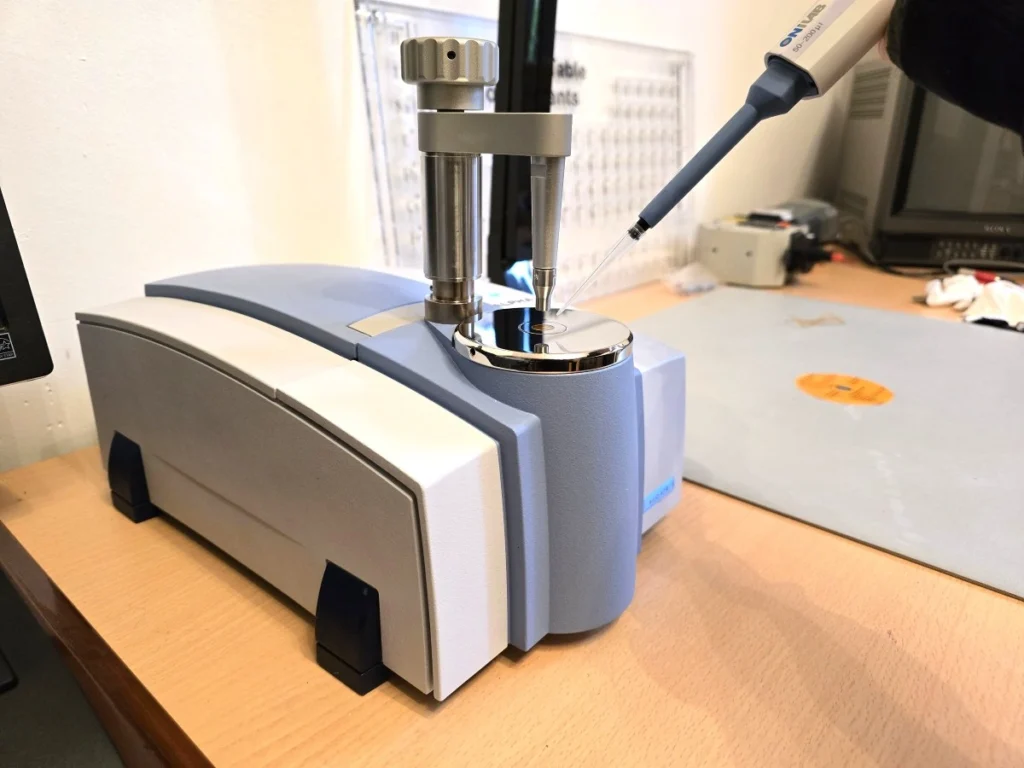
In this post, the IR spectra of some common pharmaceutical drugs and vitamin supplements are presented in the sections below.  You can click on each spectrum for a larger view. All spectra were obtained with a Bruker Alpha One FTIR spectrometer using an ATR accessoryThe ATR is a single-bounce zinc selenide (ZnSe) crystal. All spectra are an average of 24-32 scans with resolutions of either 2 cm-1 or 4 cm-1. This is fine for general purpose infrared work.

Apart from the occasional comment, I will not be providing full assignments of vibrational peaks for these spectra, as I did in previous posts on much simpler organic molecules.  The fingerprint region (1400-600 cm-1) of all these compounds is extremely rich. These are example spectra of either the pure compound or a known tablet or other formulation.

The best approach to take, when faced with an unknown sample, is to use a specialised searchable database of FTIR spectra, which can contain many thousand spectra of pure samples and mixtures. These often come with the spectrometer control software or can be used online. Unfortunately, the most useful databases are behind paywalls, although there are free ones that do have some value.

The Bruker Alpha One FTIR spectrometer image
The Bruker Alpha One FTIR spectrometer with ATR Accessory

The Infrared Spectra...

Aspirin

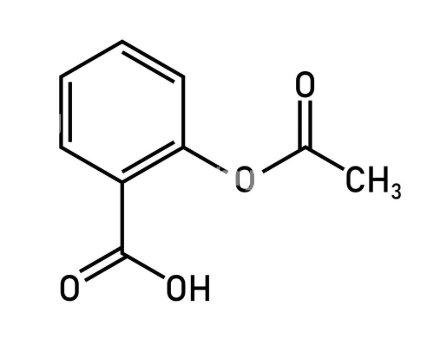
It is fair to say that Aspirin is probably the oldest and most well known commercially produced drug in the world. It was invented by the Bayer company in Germany and was first introduced, rather incredibly, at the very end of the 18th century! Its usual chemical name is acetylsalicylic acid, although there do exist several other IUPAC descriptions.

The chemical structure of aspirin is

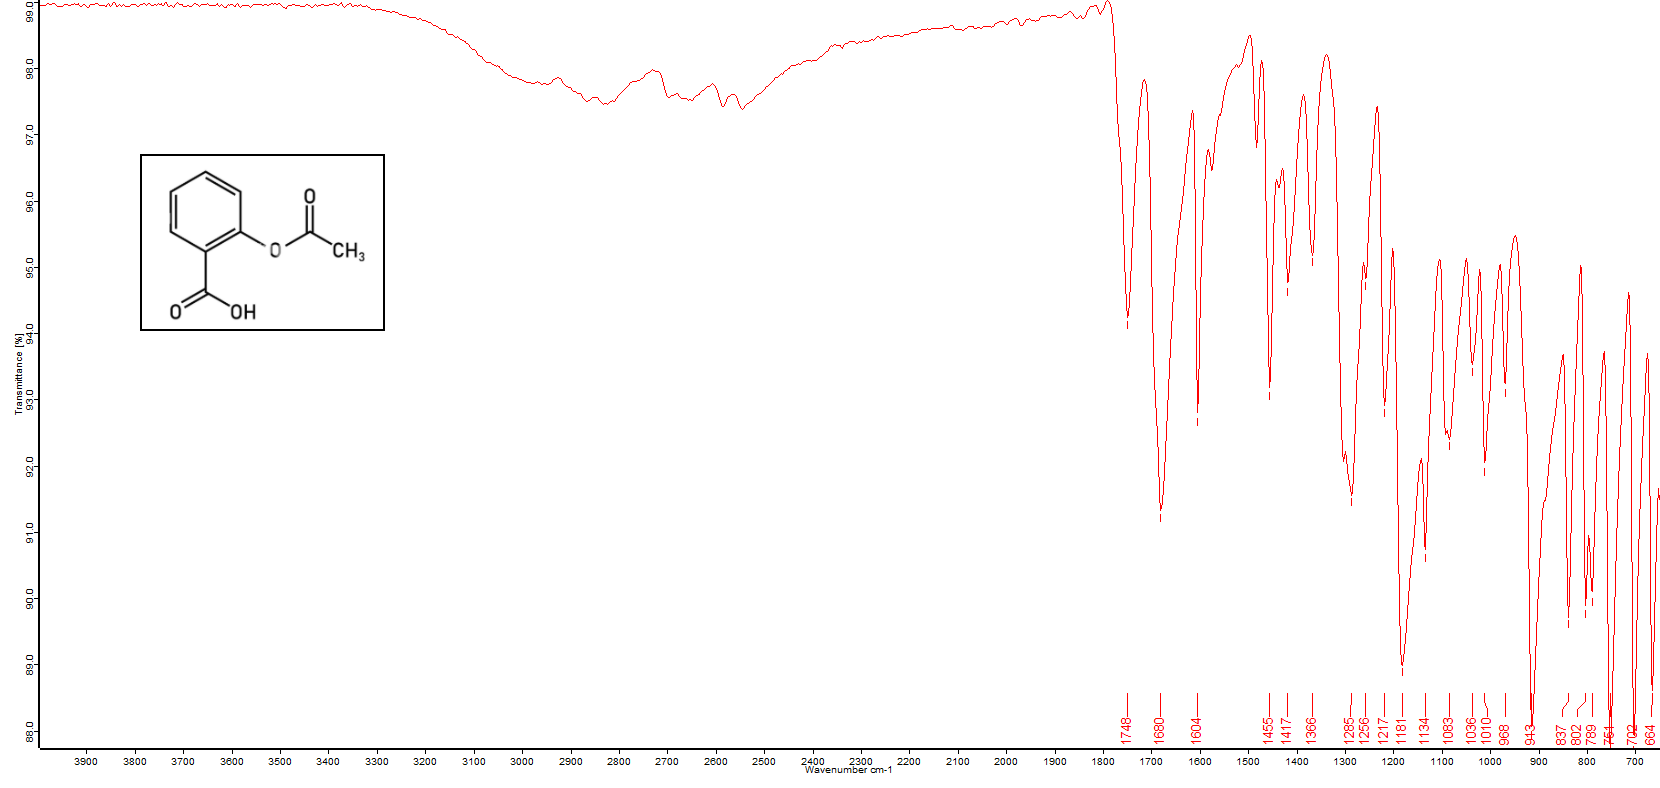
and the IR spectrum is given here:

IR spectrum of pure Aspirin
FTIR-ATR Spectrum of Pure Acetylsaliylic Acid (Aspirin)

This is the spectrum of pure (> 99.5%) acetylsalicylic acid and not an Aspirin tablet. The spectrum is well defined, and relatively simple as far as infrared spectra go for this reason … it’s a very pure sample. When we come to some actual tablets, the spectrum can be noisier (in terms of baseline noise) and sometimes more complex for the reasons described now…

Pharmaceutical quality tablets, as well as supplement tablets, all contain additional raw materials called excipients. These are necessary to form a physically solid and stable tablet shape with a long shelf life. In addition to the API (Active Pharmaceutical Ingredient), a tablet will contain a binder such as cellulose or starch, fillers such as lactose or calcium salts. And with tablets there will always be a lubricant material such as magnesium stearate.

The lubricant is there because all pharmaceutical grade tablets and capsules, as well as vitamin supplements and so on, are produced on an industrial scale in a high speed rotary press. These presses typically produce 20,000 – 100,000 tablets per hour, even for a medium-speed machine. All these tablets need to be rapidly ejected from the press tooling before being filled again with raw materials. The lubricant serves to allow clean ejection of every tablet from the press.

As a result, all these additives can sometimes (but not always) contribute to the complexity of an IR spectrum. Some examples are given below.

Paracetamol (Acetaminophen)

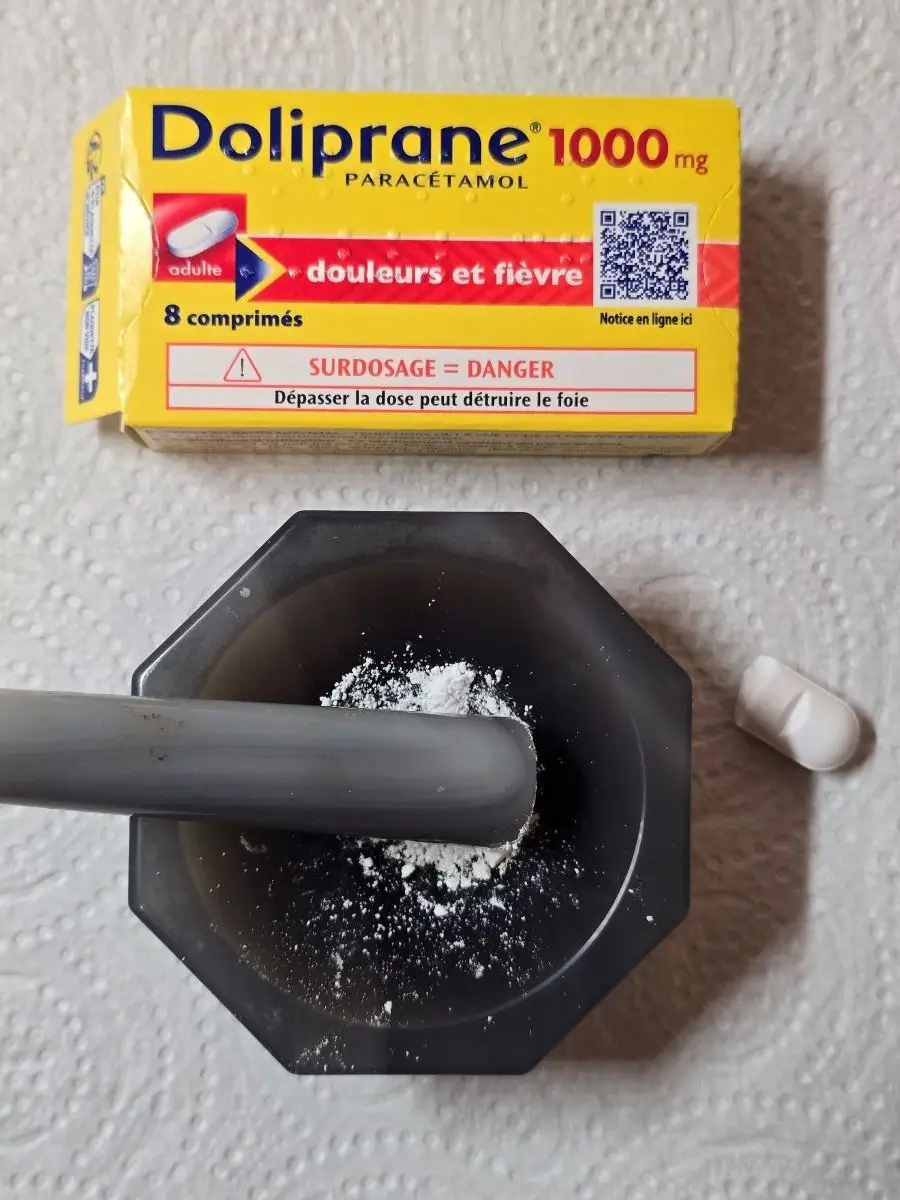
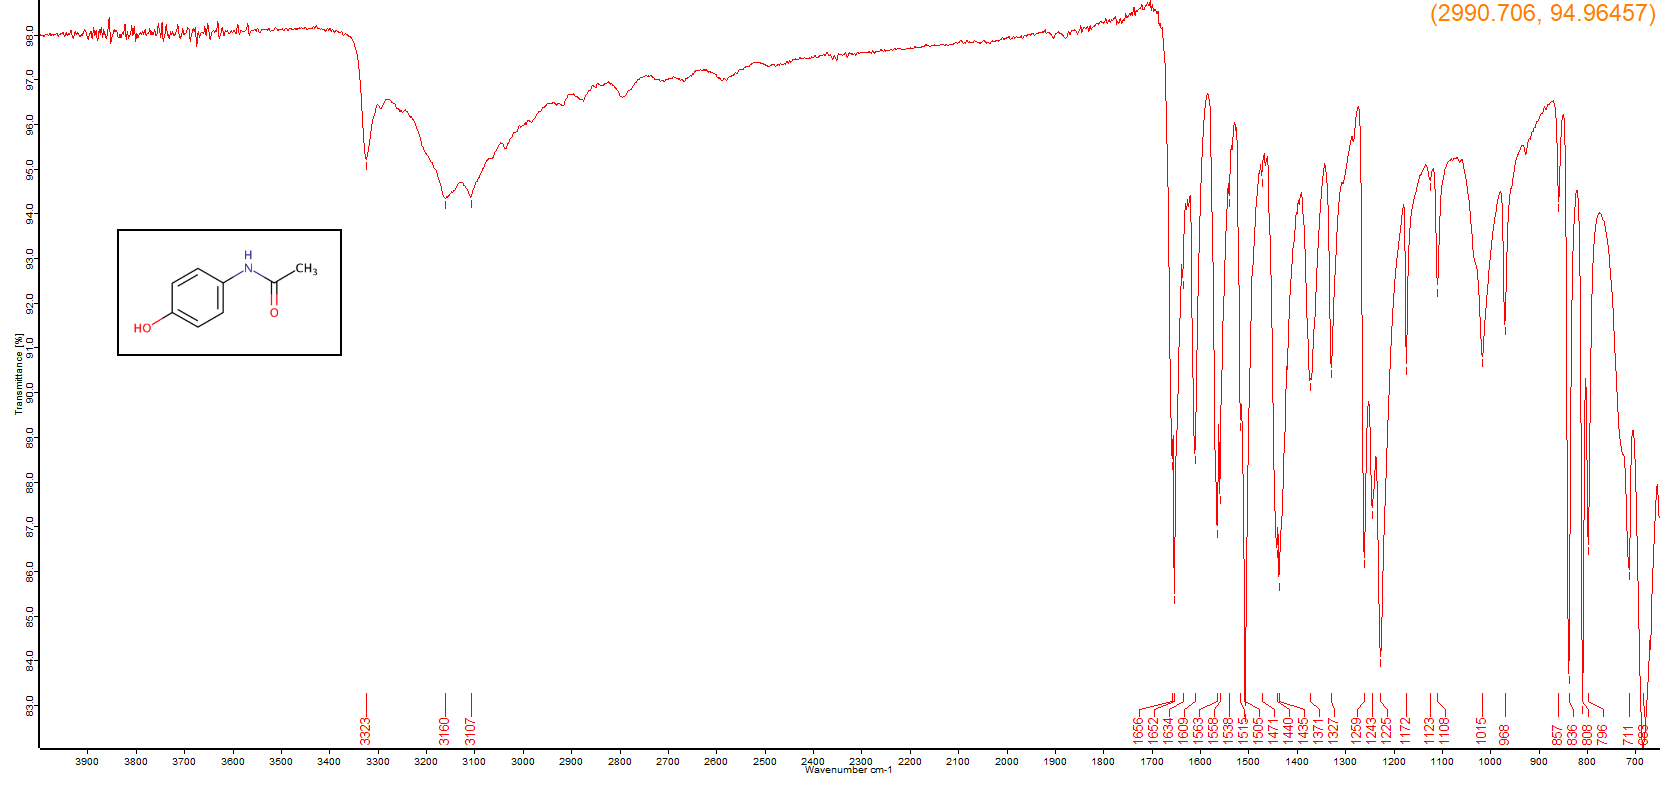
After aspirin, paracetamol is perhaps the second most well known of the common drugs and is a mild analgesic. Instead of the pure compound, we are dealing with a tablet formulation here. A single tablet was ground to a fine powder in a mortar & pestle, a typical procedure used for sample preparation prior to examining it by ATR. Shown here in the following picture:

A screw press (which is a part of the ATR accessory of the spectrometer and pictured earlier) applies hand pressure to the finely ground sample to ensure good contact with the ATR crystal. The resulting spectrum is shown here:

FTIR Spectrum of a paracetamol tablet
FTIR-ATR Spectrum of a Paracetamol Tablet

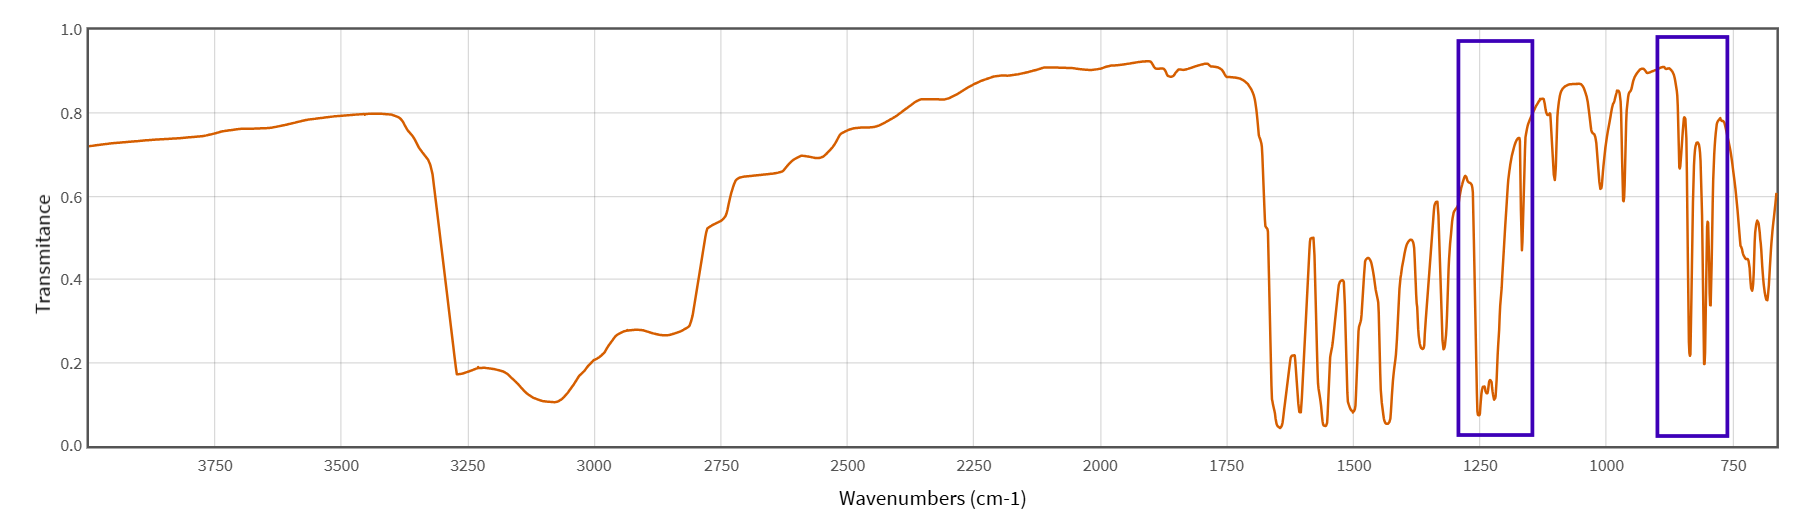
This is quite a clean spectrum of a paracetamol tablet, showing well-defined vibrational absorption bands from the active molecule, particularly in the fingerprint region. Just out of interest, pictured below is a spectrum from pure acetaminophen (not from a tablet) recorded with a much older dispersive IR instrument from the NIST Chemistry Webbook Database:

Old dispersion spectrum of acetaminophen
An old dispersion spectrum of paracetamol from a Nujol mull prep.

The difference in resolution is quite remarkable, as the blue rectangular boxes and elsewhere in the spectrum highlight. This is a good example of how much Fourier transform IR spectrometers transformed infrared techniques (pun intended!) and how far they have come. For more background on the history of the instruments, you can go to parts 1 and 2 of my posts mentioned earlier.

Atorvastatin

Atovastatin (commonly known by the brand name Lipitor in several countries) is one of the statin drugs used for lowering cholesterol. By 2012 atorvastatin, under the brand name Lipitor, became the world’s best-selling medication of all time, with more than $125 billion in sales over approximately 14 years.

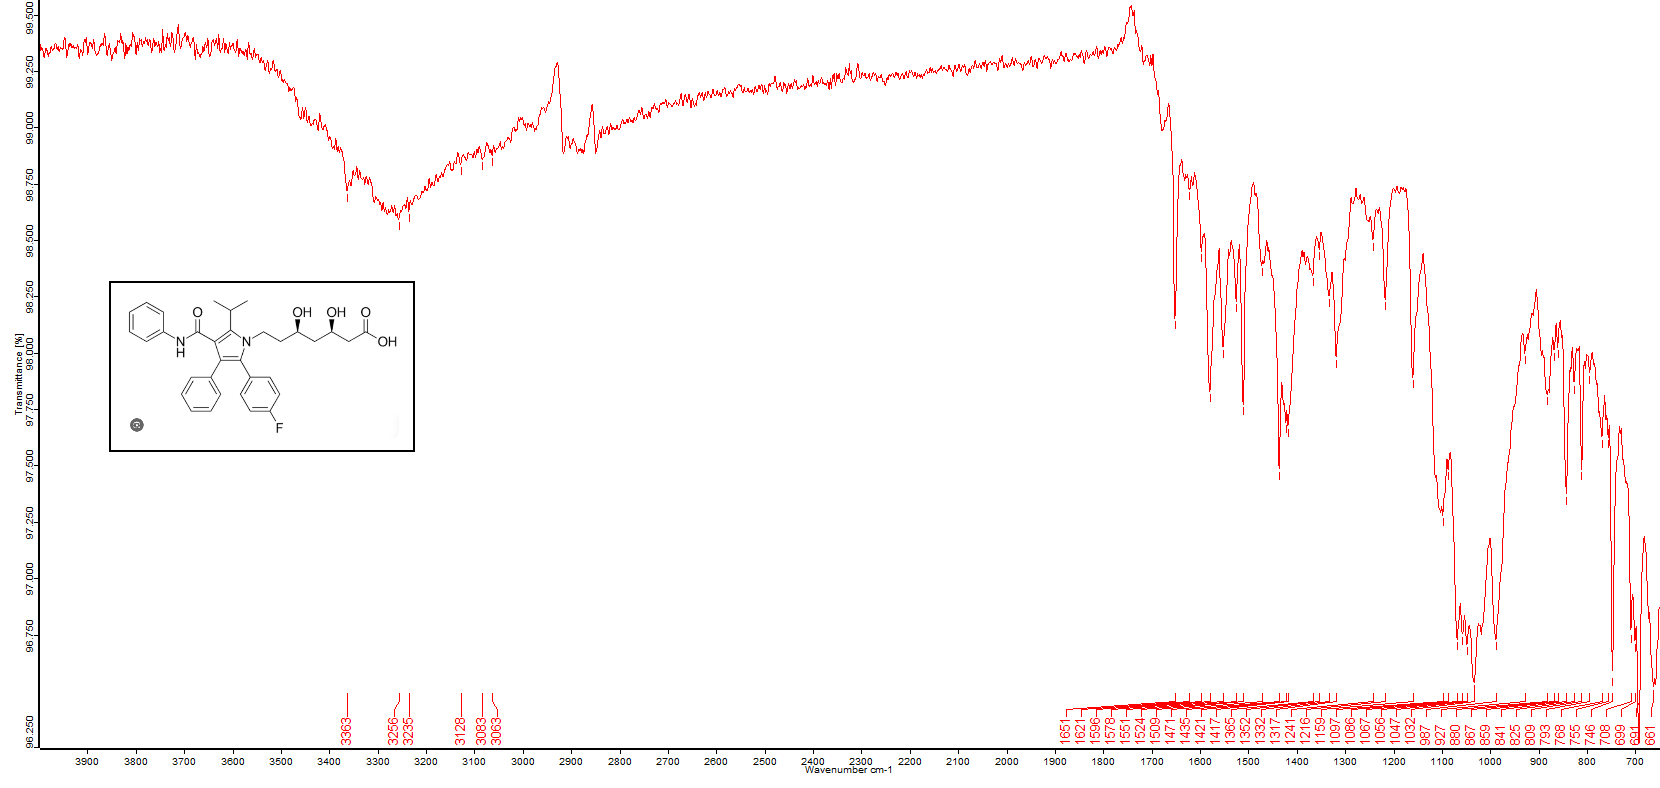
A single tablet was prepared in the same way as the paracetamol tablet, and the resulting spectrum is shown below:

FTIR spectrum of Atorvastatin

Omeprazole

Omeprazole is a proton pump inhibitor, or PPI. PPI’s are drugs that reduce stomach acid production by permanently blocking the enzyme that functions to acidify the stomach. The effects can last for several days and the drug is very effective at eliminating the symptoms of acid reflux and heartburn. Eventually, new proton pumps are naturally created by the body by normal cell processes and acid production and normal stomach acidity returns. 

The drug has to be protected with an enteric coating. This is often a special polymer that acts as a barrier to prevent the active drug molecule from being destroyed in the highly acidic (pH 1-3) conditions in the stomach. When the drug passes into the small intestine, the higher pH, less acidic, conditions allow the polymer of the enteric coating to dissolve and release the drug, where it can be absorbed.

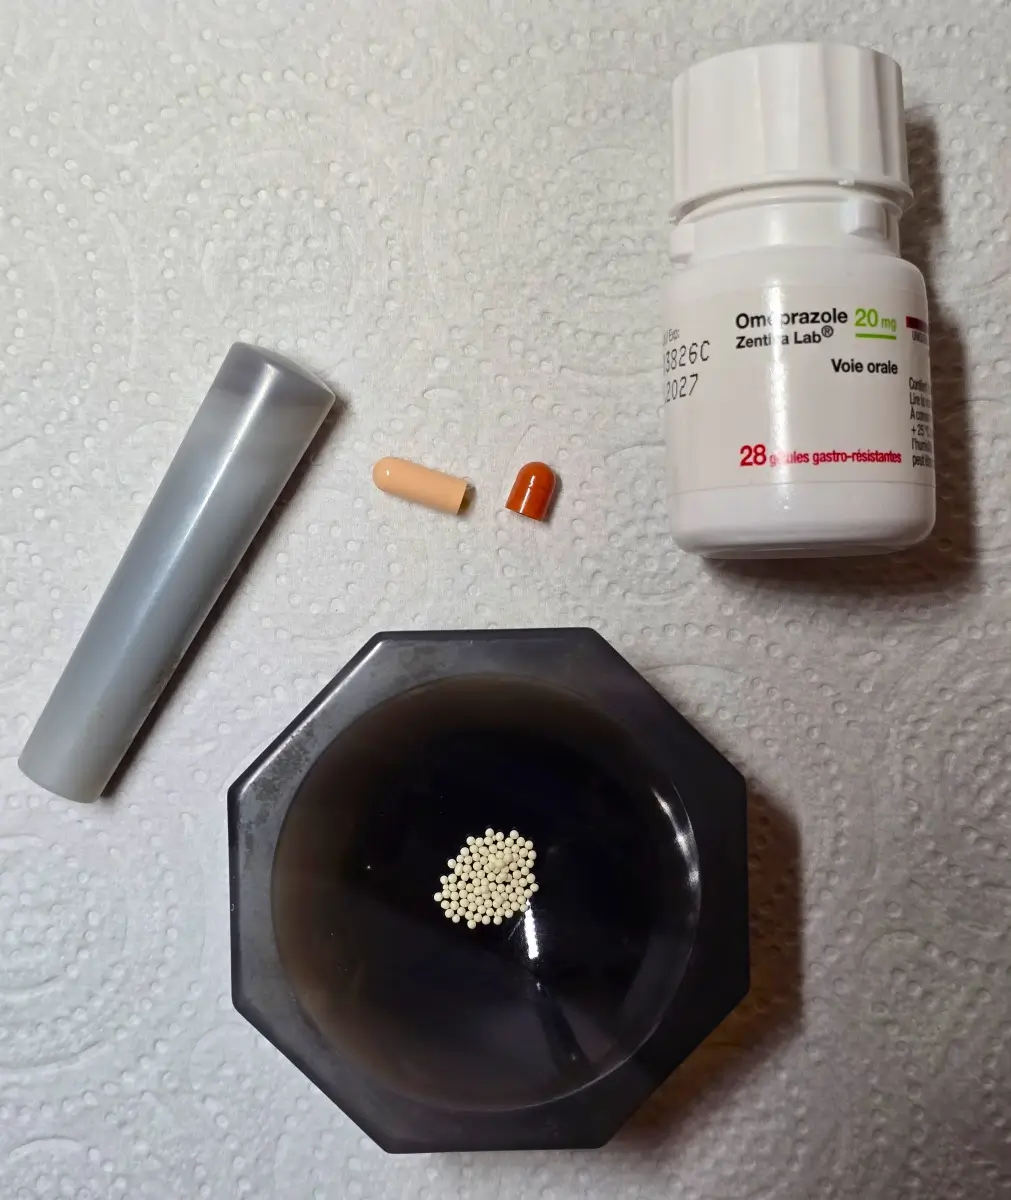
An example is shown here, where I have split open a single capsule of Omeprazole revealing the granules inside. Each of those tiny granules will have an enteric coating, with the API protected inside. If this was a tablet and not a capsule, the whole tablet would have an enteric coating.

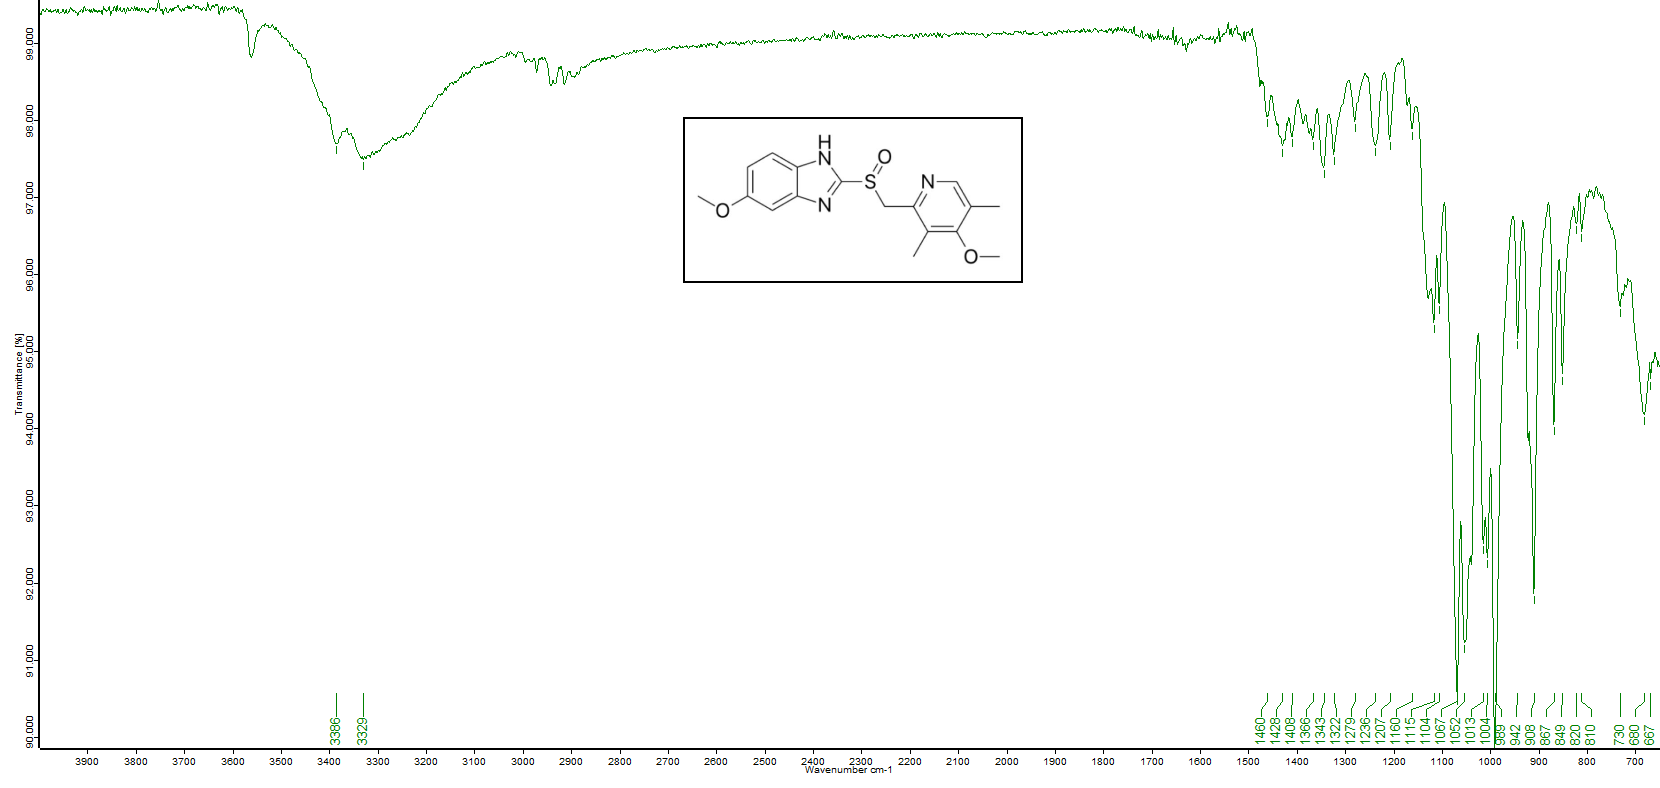
The FTIR spectrum of those finely ground up granules can be seen here: 

FTIR spectrum of omeprazole
The FTIR-ATR spectrum of Omeprazole

Cholecalciferol

Not a pharmaceutical drug this time, but a vitamin. Cholcalciferol is Vitamin D3, one of the 4 oil (lipid) soluble vitamins, all the rest being soluble in water. All lipid soluble vitamins are stored in the body’s liver and fatty tissues. Vitamin D3 is used for “fixing” calcium for strong and healthy bones.

When used as a supplement for oral administration, cholecalciferol is dissolved in a vegetable oil with other ingredients such as antioxidants. This liquid formulation has a very limited shelf life of only several months. When obtained from a pharmacy, it often comes in the form of a breakable, amber-coloured glass vial. And when broken open it must obviously be used immediately. Other pharmaceutical forms include softgels (soft gelatin capsules) that can last 2-3 years if stored correctly.

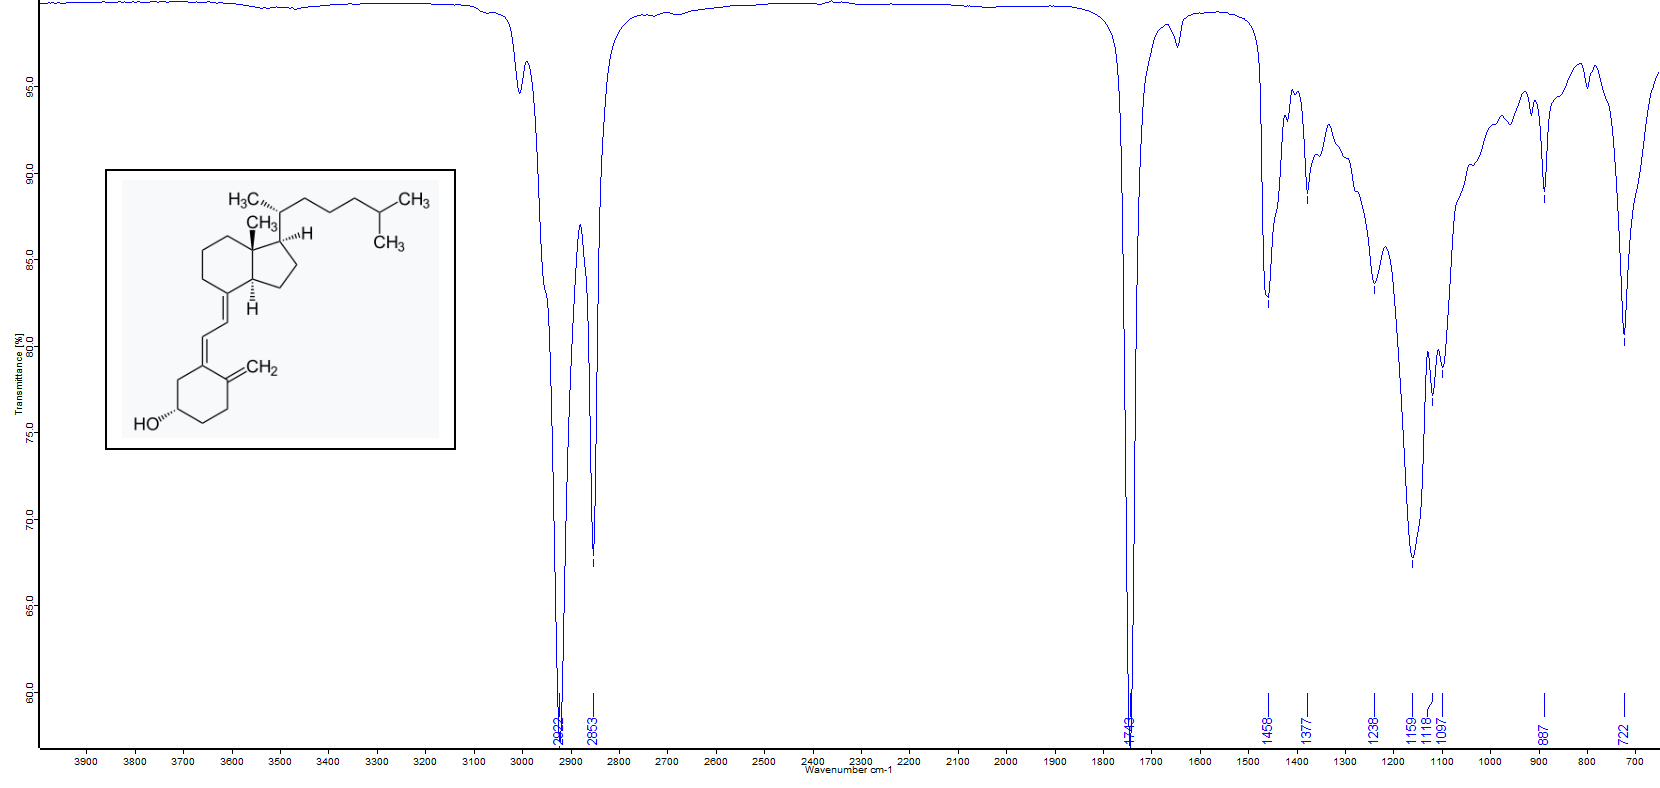
In Fig. 6 is the FTIR spectrum of the liquid formulation.

FTIR Spectrum of Vitamin D3
Fig. 6 - The FTIR Spectrum of Cholecalciferol (Vitamin D3)

The interesting thing here is that the major contributor to the spectrum is the vegetable oil, which is a triglyceride. In fact, the oil dominates the spectrum. Vitamin D3 is only contributing a few weak bands, largely because it is normally present at a much lower concentration than the carrier oil.

There is a very weak shoulder at ∼ 3005 cm-1 which a C-H stretching vibration from an alkene (=C-H). But both the vitamin and the oil possess these vibrations, therfore it is not possible to assign this weak band uniquely to the vitamin.

The two very strong bands around 2900 cm-1 and 2800 cm-1 are aliphatic methylene (CH2) stretching vibrational modes and the strong band at 1743 cm-1 is the C=O ester carbonyl group of the triglyceride oil, which is diagnostic. The very weak band around 1635-1650 cm-1 may be the C=C stretch in the structure of the vitamin. Again, however, the oil also has unsaturated fatty acids with C=C bonds. All remaining bands in the fingerprint region are very likely due to the oil.

Cetirizine

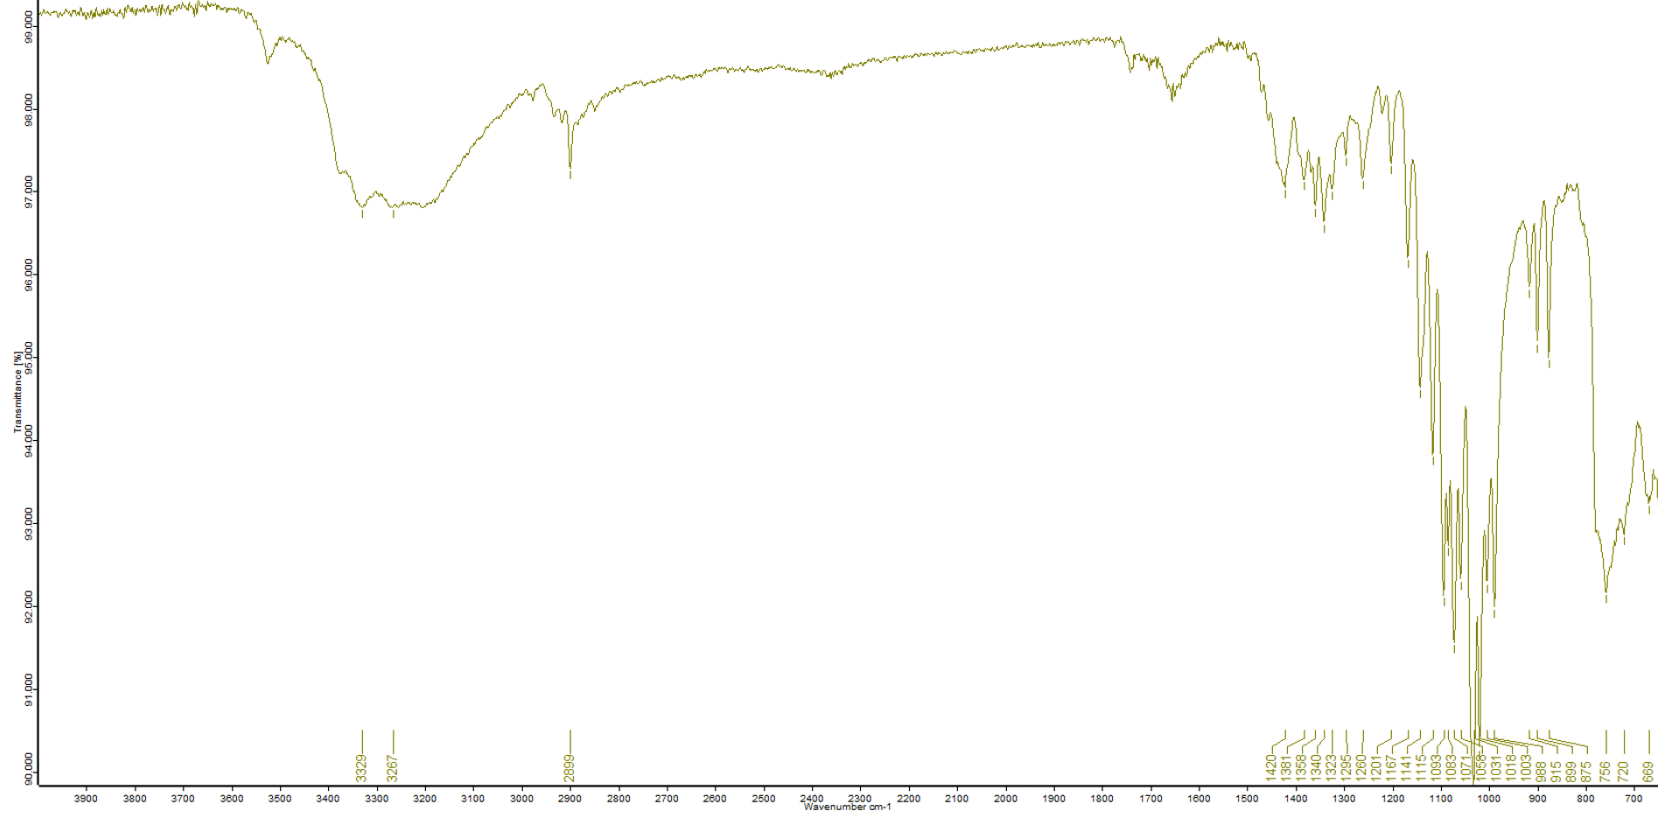
Cetirizine is a common antihistamine used to reduce the symptoms of hay fever. Usually taken orally in the form of a small tablet. The IR spectrum of the tablet form is presented in Fig. 7. 

FTIR image of cetirizine spectrum
Fig. 7 The FTIR Spectum of Cetirizine

The spectrum is quite complex, especially in the Fingerprint region (1500-600 cm-1) which is very “busy”. Therefore this deserves some further explanation and analysis.

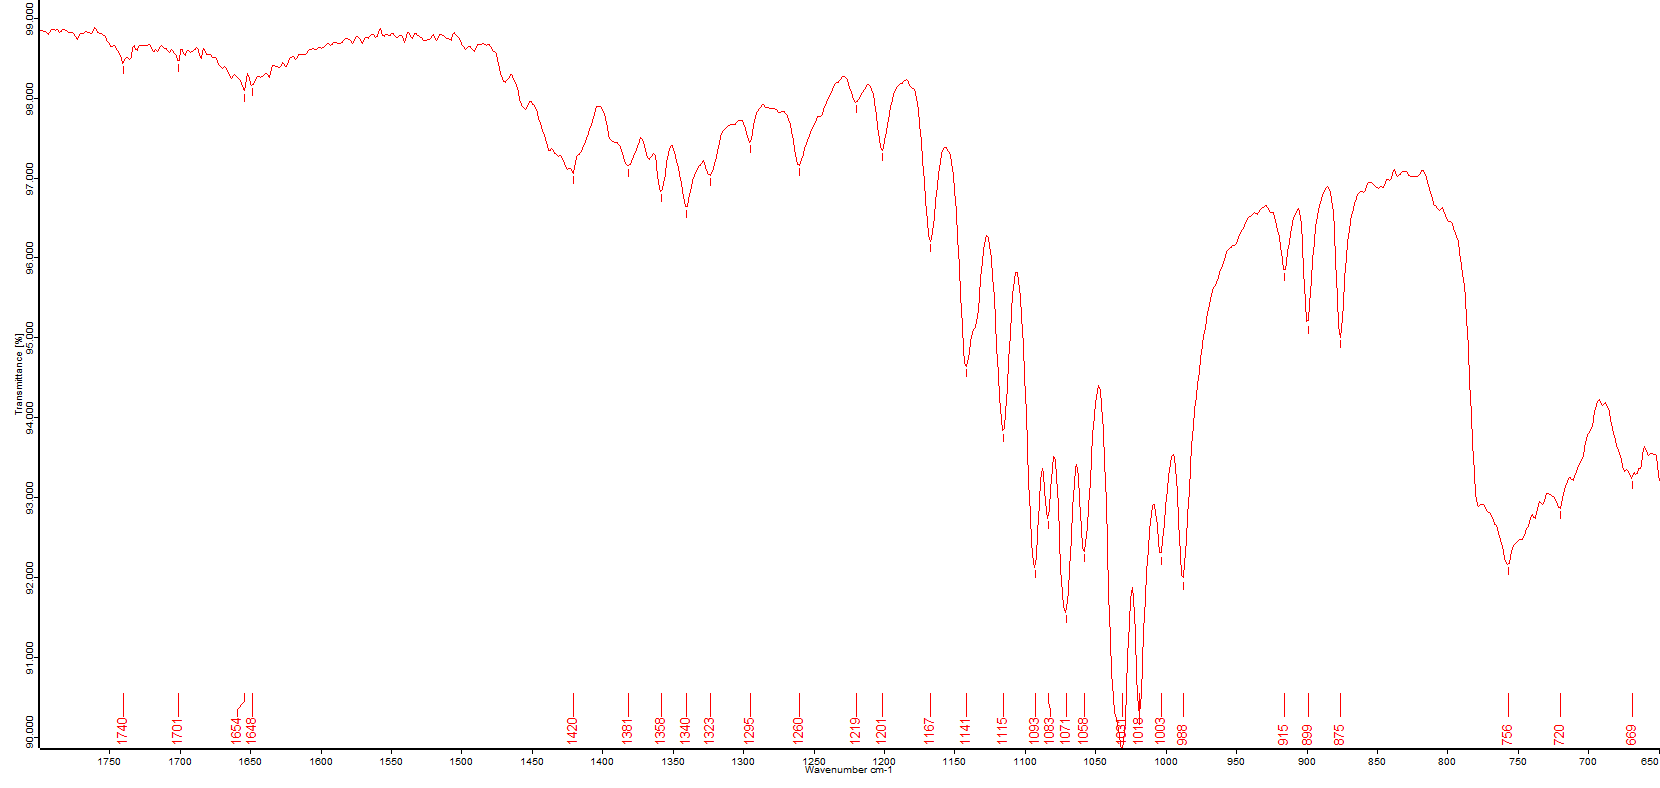
In Fig. 8 I have zoomed in on the Fingerprint region:

Close up view of Fingerprint Region
Fig. 8 - Close-up View of the Fringerprint Region

As mentioned earlier, with pharmaceutical tablet formulations, the excipients (which are necessary for manufacture) can make the IR spectrum more complicated and contribute to the spectrum. This is a case in point. The API bands are present, but the intense fingerprint region (1200–900 cm⁻¹) is almost certainly a convolution of cetirizine with common tablet fillers (microcrystalline cellulose, lactose, starch, etc.).

Chemically, the most common form of the API supplied to patients is cetirizine dihydrochloride (cetirizine · 2HCl) not the zwitterionic form. This is the one in Figures 7 and 8. [If we had the free acid/zwitterionic form, several bands in the spectrum would change, which is why FTIR spectroscopy is useful for determining different salts of the same drug.]

I have attempted assigning vibrational bands to this spectrum, which is provided here:

Table 1. Vibrational Assignments for a Cetirizine Tablet Formulation.

Approx. ν / cm⁻¹Relative observed intensityAssignmentComment
3390weakO–H stretching, COOH / possibly N–H⁺Broad/weak high-frequency component
3265mediumO–H / N–H⁺ stretchingH-bonded; overlaps the broad OH/NH envelope
~3000–3030very weakAromatic C–H stretchingPhenyl rings
2899very strongν(CH₂), aliphaticPiperazine/side-chain CH₂; unusually prominent in this spectrum
~2700–2300weak–medium, broad/structuredStrongly H-bonded COOH O–HCarboxylic-acid OH often extends over this region; individual components are poorly resolved here
1739very strongν(C=O), carboxylic acidOne of the principal diagnostic API bands
~1660–1600weakAromatic C=C stretching; possible NH⁺/ionic contributionsCongested/weak
1465strongCH₂ deformation/scissoringAliphatic/piperazine CH₂
~1420weak–mediumCH₂ deformation / aromatic skeletal contributionMixed band
1378mediumCH₂/CH deformationPiperazine/alkyl portion
1352mediumCH₂ deformation + C–N contributionPiperazine/side chain
1245strongC–O stretching / ether C–O–C; COOH C–O contributionAPI + possible excipient overlap
1170strongC–O–C / C–O stretchingEther linkage; matrix contributions possible
1118very strongC–O / C–N stretchingStrong fingerprint-region band
1098very strongC–O / C–N stretchingStrong, overlapping fingerprint absorptions
~1050–1000medium–strongC–O, C–N, aromatic skeletal modesParticularly susceptible to excipient contributions
~930–880weak–mediumAromatic C–H out-of-plane / ring modesSubstituted phenyl groups
~800–750medium–strongAromatic C–H out-of-plane; C–Cl-associated modesChlorophenyl ring
~720weak–mediumAromatic/ring deformationMay include formulation/excipient contribution

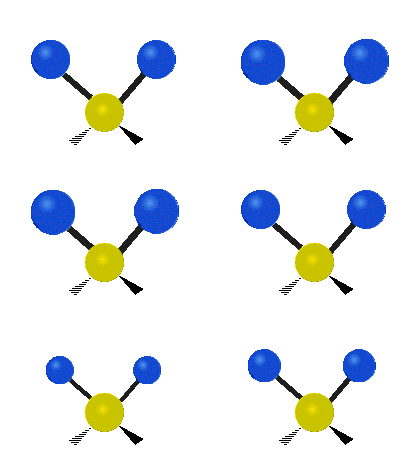
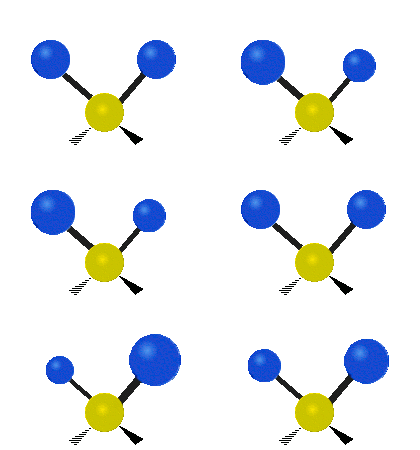
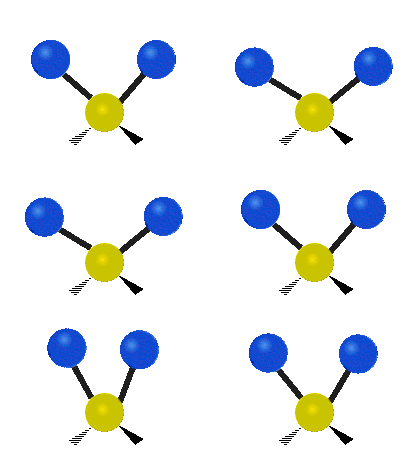
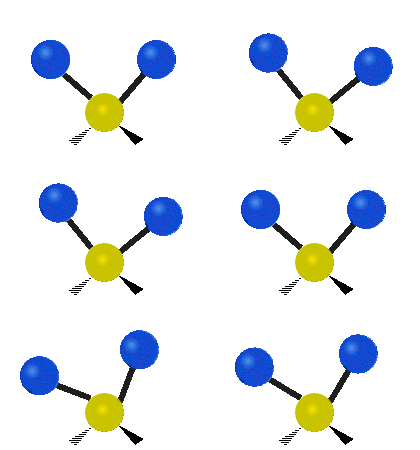
To explain the terminology in the Assignment column in the table above, here are the six different fundamental modes of vibrating molecules shown in these simple animations:

Jojoba Oil

After that fairly lengthy description and assignment, this is a much simpler IR spectrum of Jojoba oil.  Jojoba oil is a long chain vegetable oil, or wax, extracted from the seeds of the jojoba plant. There are claims that the oil helps to maintain healthy skin and hair, and its chemical structure is in fact similar to human sebum, the natural oil produced by the scalp and skin. However, there have never been any clinical trials to demonstrate any benefits.

A unique chemical feature of jojoba oil is that it is not a triglyceride such as olive, sunflower and other vegetable oils. It is composed almost entirely (>97%) of long-chain mono-unsaturated esters, formed from equally long-chain fatty acids and alcohols. 

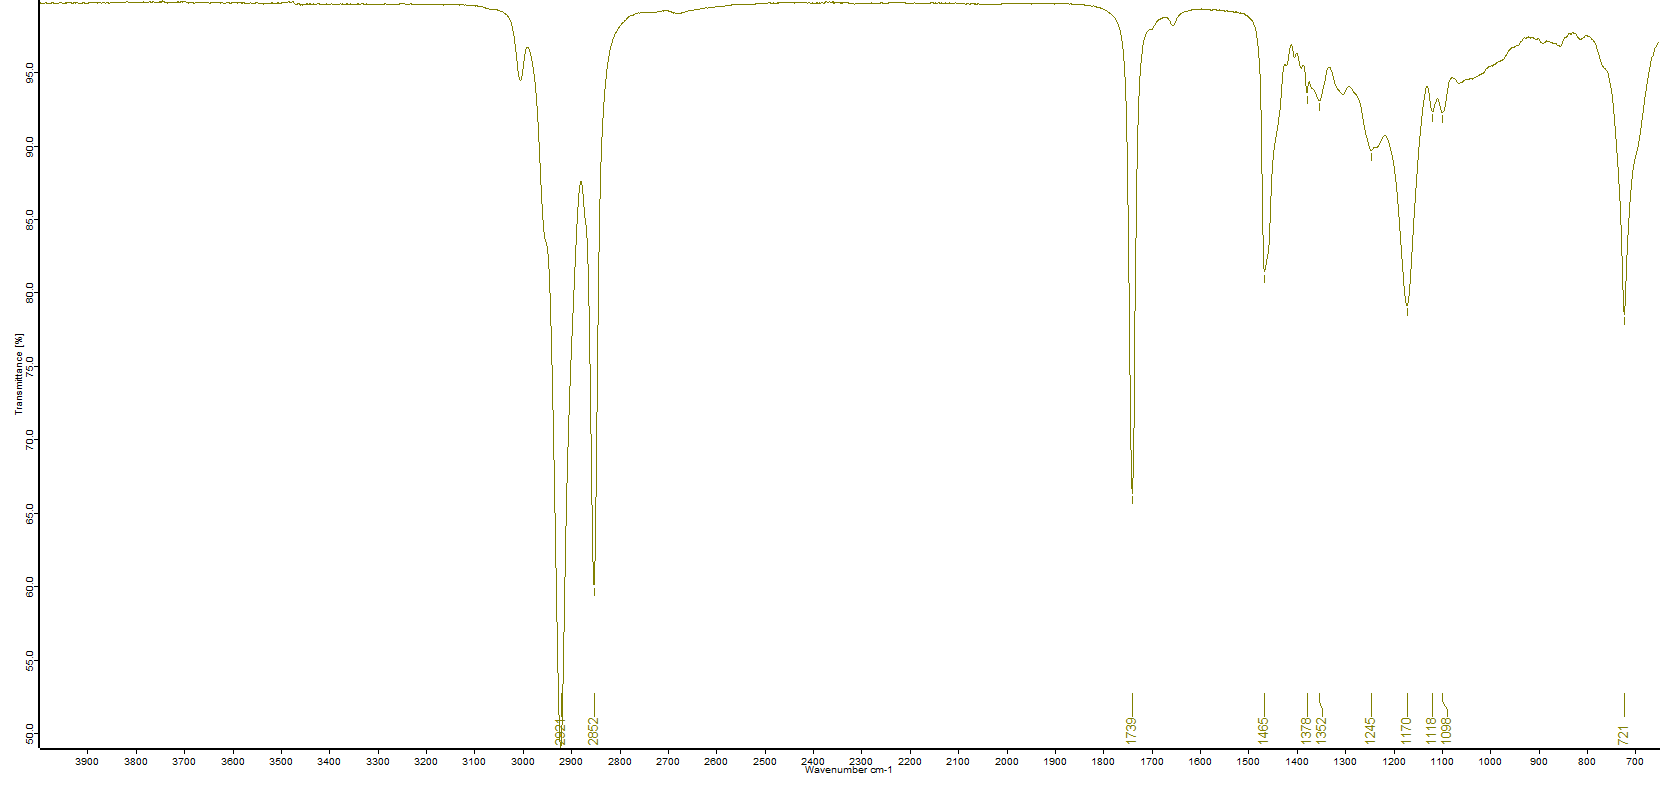
As a result, the FTIR spectrum of jojoba oil is relatively straightforward.

The FTIR ATR spectrum of jojoba oil
Fig. 9 The FTIR Spectrum of a Sample of Jojoba Oil
The principal IR absorptions here are as follows:
  • The weak shoulder at 3005 cm-1 is the C-H stretching vibration from cis double bonds in the ester chain.
  • The intense bands at 2922 cm-1 and 2852 cm-1 are respectively the asymmetric and symmetric stretch vibrations of the long CH2 chains.
  • The band at 1739 cm-1 is the C=O carbonyl stretching vibration from the long chain ester.
  • There is a very weak cis alkene stetching absorption around 1640 cm-1 which is not labelled in the figure.
  • At 1465 cm-1 is the scissoring vibration from the long alkyl chains.
  • The terminal methyl CH3 groups have symmetric deformations at 1378 and 1362 cm-1, quite weak because their number is low relative to the number of CH2 groups in the molecule.
  • The band at 1245 cm-1 is likely to be a C-O-C stretch from the ester.
  • The stronger band at 1170 cm-1 is C-O stretch, again from the ester linkage.
  • And the two weak bands at 1118 and 1098 cm-1 are again C-C-O and C-O stretching modes for the ester.
  • Finally, the strong and broader (multi-component) band at 721 cm-1 is the Rocking Mode from the long polymethylene (CH2)n chain.

Voltaren (or Volterol)

Lastly, we come to Voltaren®, often called by the brand name Voltarol in the Anglo-Saxon speaking world. The API here is the sodium salt of diclofenac diethylamine, and is formulated as a gel for topical application. It is also termed an emulsified gel, or emulgel.

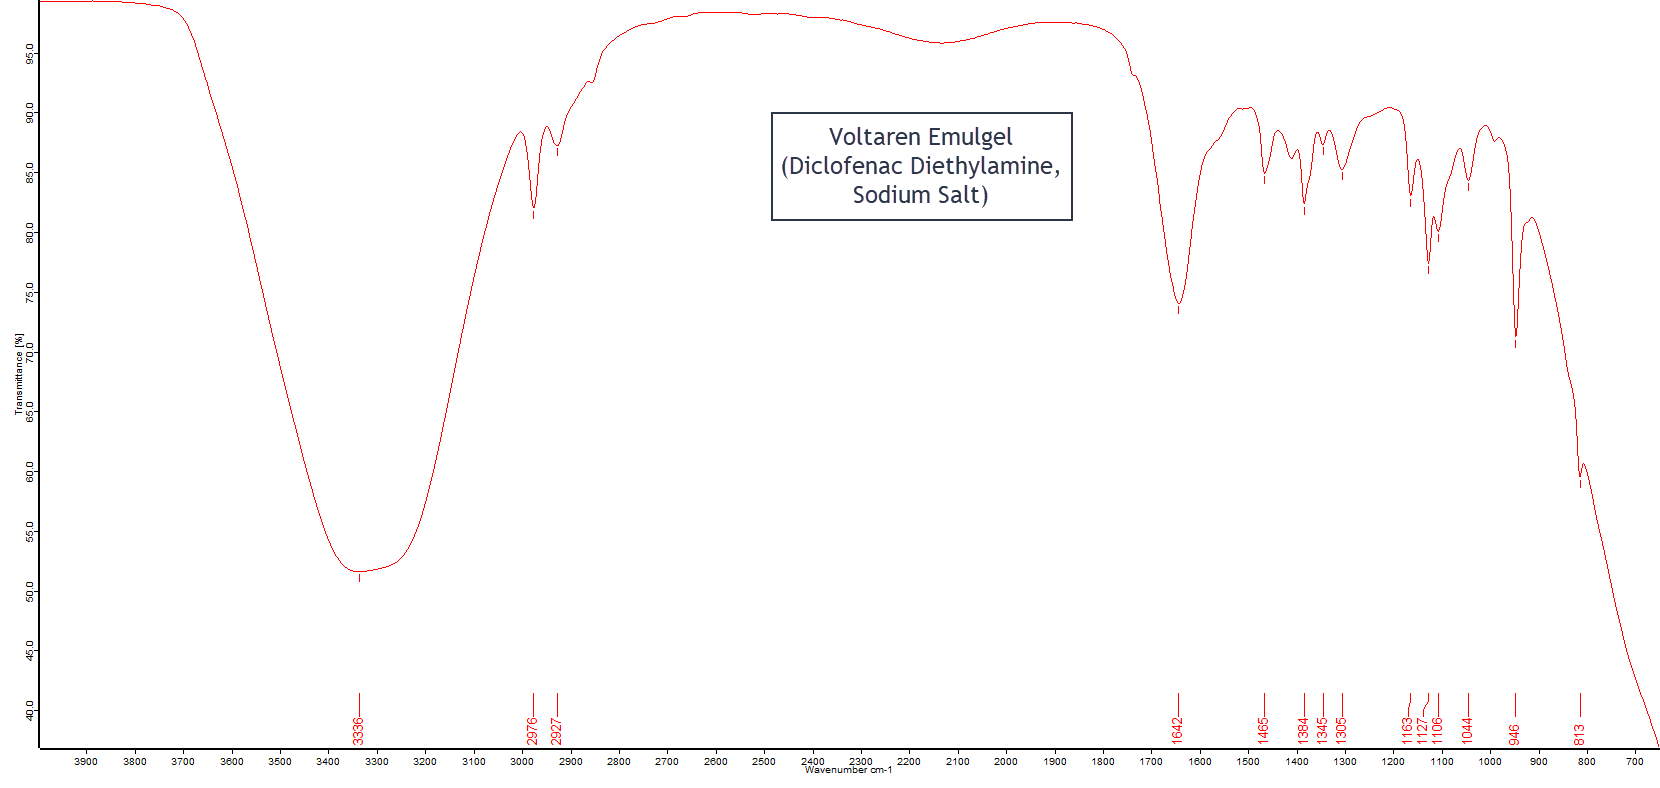
FTIR spectrum of Voltaren emulgel
Fig. 10 The FTIR Spectrum of Voltaren Emulgel

Overall, this spectrum is dominated by the consituents of the gel vehicle and not by the diclofenac active drug, which is present only at 1%. The 1% refers to the sodium salt, sodium diclofenac. When formulated in the gel form as diclofenac diethylamine the concentration becomes 1.16%. From the patient information leaflet or PIF (and yes, I do use it on occasion!) the other constituents are Carbomer 974P, cetomacrogol 1000, caprylic acid esters with C12–C18 fatty alcohols, isopropanol, liquid paraffin, a “rose fragrance” containing benzyl benzoate, propylene glycol and purified water.

[Personal Note:   So how come I know all this, I hear you say? I used to work for the company that developed the formulation!  😆😉.]

But let’s return to evaluating the spectrum. Rather than go into very great detail, since I know this spectrum so well, it is better to summarize it in a concise table by considering a given spectral region and naming the main contributor to the IR absorption band(s). This is shown here in Table 2: 

Table 2. Summary of the Main Contributors to the FTIR Spectrum of Diclofenac Emulgel

Spectral regionMain contributor
3700–3000Water / propylene glycol / carbomer
3000–2850Paraffin + fatty ester + diethylamine + other organics
~1650Water + diclofenac COO⁻
1500–1350Mixed; diclofenac COO⁻ + alkyl groups
1300–1000Excipients dominate
1000–900Mostly formulation matrix, some API
900–700Aromatic diclofenac modes become relatively more useful

Final Words...

This article, of course, represnts just a tiny sample, and the tip of the iceberg, when it comes to examining the infrared spectra of OTC pharmaceutical drugs and supplements in common use today. But it gives you some idea of the complexity of these spectra in many cases, particularly for tablet and gel formulations, where many excipients can, and do, sometimes dominate the spectrum.

In a future article, I may return to much simpler chemistry and spectra, perhaps starting with the simple hydrocarbons 😆.

Thanks for finally getting to the end!

Add Your Heading Text Here

Logo

From the Laboratory Notebook at Steve's Open Lab

Steve’s Open Lab documents instrument development, independent lab investigations and practical scientific demonstrations. Some articles describe complete experiments, while others record progress in longer-term research projects as new observations become available. Whether you’re looking for a quick experiment or following an ongoing investigation, I hope you’ll find something here that sparks your own curiosity.

About Steve    •    Explore the Notebook

Leave a Comment

Your email address will not be published. Required fields are marked *

More from the Notebook

Scroll to Top